About the Performance Service
The Performance Service automatically collects and organizes performance diagnostic information into a set of data dictionary tables that can be queried with CQL.
The DataStax Enterprise Performance Service automatically collects and organizes performance diagnostic information from Cassandra and DSE Search into a set of data dictionary tables. These tables are stored in the dse_perf keyspace and can be queried with CQL using any CQL-based utility, such as cqlsh, DataStax DevCenter, or any application using a Cassandra CQL driver.
Use this service to obtain database metrics and optimize Cassandra performance and fine-tune
DSE Search. Examples include:
- Identify slow queries on a cluster to easily find and tune poorly performing queries.
- View latency metrics for tables on all user (non-system) keyspaces.
- Collect per node and cluster wide lifetime metrics by table and keyspace.
- Obtain recent and lifetime statistics about tables, such as the number of SSTables, read/write latency, and partition (row) size.
- Track read/write activity on a per-client, per-node level for both recent and long-lived activity to identify problematic user and table interactions.
- Detect bottlenecks in DSE Search.
See the following for a complete listing of the available diagnostic tables:
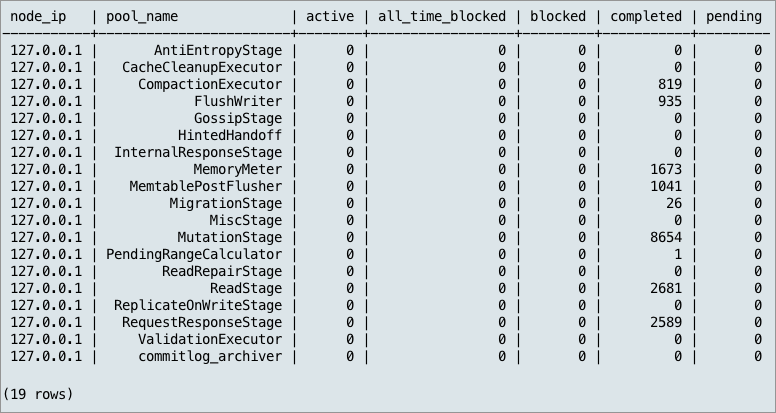
The following is sample output from querying thread pool statistics:
cqlsh:dse_perf> select * from thread_pool;
Result: