OpsCenter Metrics Tooltips Reference
Comprehensive reference of performance metrics available in OpsCenter.
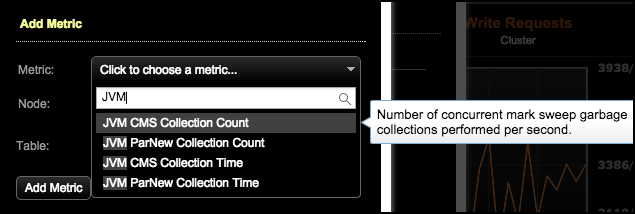
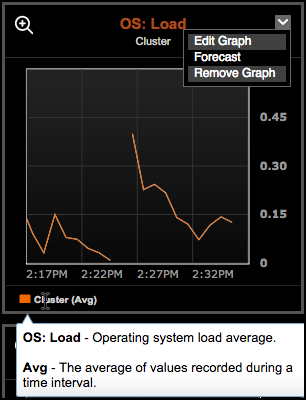
Metrics are available to add to any graph. View descriptions of any metric by hovering over a metric in the Add Metric dialog, or by hovering over a graph legend.
The following list of metric descriptions available in tooltips is provided for your convenience:
- Write Requests
- The number of write requests per second on the coordinator nodes, analogous to client writes. Monitoring the number of requests over a given time period reveals system write workload and usage patterns.
- Write Request Latency
- The average response times (in milliseconds) of a client write. The time period starts when a node receives a client write request, and ends when the node responds back to the client. Depending on consistency level and replication factor, this may include the network latency from writing to the replicas.
- Write Latency (Stacked)
- The min, median, max, 90th, and 99th percentiles of a client writes. The time period starts when a node receives a client write request, and ends when the node responds back to the client. Depending on consistency level and replication factor, this may include the network latency from writing to the replicas.
- Read Requests
- The number of read requests per second on the coordinator nodes, analogous to client reads. Monitoring the number of requests over a given time period reveals system read workload and usage patterns.
- Read Request Latency
- The average response times (in milliseconds) of a client read. The time period starts when a node receives a client read request, and ends when the node responds back to the client. Depending on consistency level and replication factor, this may include the network latency from requesting the data’s replicas.
- Read Latency (Stacked)
- The min, median, max, 90th, and 99th percentiles of a client reads. The time period starts when a node receives a client read request, and ends when the node responds back to the client. Depending on consistency level and replication factor, this may include the network latency from requesting the data’s replicas.
- Non Heap Committed
- Allocated memory, guaranteed for Java nonheap.
- Non Heap Max
- Maximum amount that the Java nonheap can grow.
- Non Heap Used
- Average amount of Java nonheap memory used.
- Heap Committed
- Allocated memory guaranteed for the Java heap.
- Heap Max
- Maximum amount that the Java heap can grow.
- Heap Used
- Average amount of Java heap memory used.
- JVM G1 Old Collection Count
- Number of G1 old generation garbage collections performed per second.
- JVM G1 Old Collection Time
- Average number of milliseconds spent performing G1 old generation garbage collections per second.
- JVM G1 Young Collection Count
- Number of G1 young generation garbage collections performed per second.
- JVM G1 Young Collection Time
- Average number of milliseconds spent performing G1 young generation garbage collections per second.
- JVM CMS Collection Count
- Number of concurrent mark sweep garbage collections performed per second.
- JVM ParNew Collection Count
- Number of ParNew garbage collections performed per second. ParNew collections pause all work in the JVM but should finish quickly.
- JVM CMS Collection Time
- Average number of milliseconds spent performing CMS garbage collections per second.
- JVM ParNew Collection Time
- Average number of milliseconds spent performing ParNew garbage collections per second. ParNew collections pause all work in the JVM but should finish quickly.
- Data Size
- The live disk space used by all tables on a node.
- Total Bytes Compacted
- Number of bytes compacted per second.
- Total Compactions
- Number of compaction tasks completed per second.
- Compactions Pending
- Estimated number of compactions required to achieve the desired state. This includes the pending queue to the compaction executor and additional tasks that may be created from their completion.
- Flushes Pending
- Number of memtables queued for the flush process. A flush sorts and writes the memtables to disk, which could block writes.
- Gossip Tasks Pending
- Number of gossip messages and acknowledgments queued and waiting to be sent or received.
- Hinted Handoff Pending
- Number of hints in the queue waiting to be delivered after a failed node comes up.
- Internal Responses Pending
- Number of pending tasks from internal tasks, such as nodes joining and leaving the cluster.
- Manual Repair Tasks Pending
- Repair tasks pending, such as handling the merkle tree transfer after the validation compaction.
- Memtable Post Flushers Pending
- Number of pending tasks related to the last step in flushing memtables to disk as SSTables. Includes removing unnecessary commitlog files and committing Solr-based secondary indexes.
- Migrations Pending
- Number of pending tasks from system methods that modified the schema.
- Misc. Tasks Pending
- Number of pending tasks from infrequently run operations, such as taking a snapshot or processing the notification of a completed replication.
- Read Requests Pending
- Number of pending read requests. Read requests read data off of disk and deserialize cached data.
- Read Repair Tasks Pending
- Number of read repair operations in the queue waiting to run.
- Repl. on Write Tasks Pending
- Number of pending counter increment tasks that will read then write on the replicas after a coordinator's local write. Depending on consistency level used on writes, tasks may back up outside of the normal write path.
- Request Responses Pending
- Number of pending callbacks to execute after a task on a remote node completes.
- Write Requests Pending
- Number of write requests received by the cluster and waiting to be handled.
- Counter Mutations Pending
- Number of counter mutation requests received by the cluster and waiting to be handled.
- Memory Meter Pending
- Pending tasks that will calculate the live ratio which is used to estimate memtable size. The live ratio is the actual memory usage of a memtable including JVM overhead as it compares it to the raw data size. There will be at most one pending task per table.
- Validation Executor Pending
- Pending task to read data from sstables and generate a merkle tree for a repair.
- Commitlog Archiver Pending
- Commitlog Archiver Pending
- Compaction Executor Pending
- Pending compactions that are known. This may deviate from "pending compactions" which includes an estimate of tasks that these pending tasks may create after completion.
- Pending Range Calculator Pending
- Pending tasks to calculate the ranges according to bootsrapping and leaving nodes.
- Native Transport Requests Requests Pending
- Native Transport Requests Requests Pending
- Flushes Active
- Number of memtables being flushed flush process. A flush sorts and writes the memtables to disk, which could block writes.
- Gossip Tasks Active
- Number of gossip messages and acknowledgments actively being sent or received.
- Hinted Handoff Active
- Number of hints actively being delivered after a failed node comes up.
- Internal Responses Active
- Number of active tasks from internal tasks, such as nodes joining and leaving the cluster.
- Manual Repair Tasks Active
- Repair tasks active, such as handling the merkle tree transfer after the validation compaction.
- Memtable Post Flushers Active
- Number of active tasks related to the last step in flushing memtables to disk as SSTables. Includes removing unnecessary commitlog files and committing Solr-based secondary indexes.
- Migrations Active
- Number of active tasks from system methods that modified the schema.
- Misc. Tasks Active
- Number of active tasks from infrequently run operations, such as taking a snapshot or processing the notification of a completed replication.
- Read Requests Active
- Number of active read requests. Read requests read data off of disk and deserialize cached data.
- Read Repair Tasks Active
- Number of read repair operations actively being run.
- Repl. on Write Tasks Active
- Number of active counter increment tasks that will read then write on the replicas after a coordinator's local write. Depending on consistency level used on writes, tasks may back up outside of the normal write path.
- Request Responses Active
- Number of callbacks to being executed after a task on a remote node is completed.
- Write Requests Active
- Number of write requests received by the cluster and being handled.
- Counter Mutations Active
- Number of counter mutation requests received by the cluster and being handled.
- Memory Meter Active
- Active tasks that calculate the live ratio which is used to estimate memtable size. The live ratio is the actual memory usage of a memtable including JVM overhead as it compares it to the raw data size. There will be at most one pending task per table.
- Validation Executor Active
- Active task to read data from sstables and generate a merkle tree for a repair.
- Commitlog Archiver Active
- Commitlog Archiver Active
- Compaction Executor Active
- Active compactions that are known.
- Pending Range Calculator Active
- Active tasks to calculate the ranges according to bootsrapping and leaving nodes.
- Native Transport Requests Requests Active
- Native Transport Requests Requests Active
- Flushes Completed
- Number of memtables recently flushed. A flush sorts and writes the memtables to disk, which could block writes.
- Gossip Tasks Completed
- Number of gossip messages and acknowledgments recently sent or received.
- Hinted Handoff Completed
- Number of hints recently delivered after a failed node comes up.
- Internal Responses Completed
- Number of recently completed tasks from internal tasks, such as nodes joining and leaving the cluster.
- Manual Repair Tasks Completed
- Repair tasks recently completed, such as handling the merkle tree transfer after the validation compaction.
- Memtable Post Flushers Completed
- Number of completed tasks related to the last step in flushing memtables to disk as SSTables. Includes removing unnecessary commitlog files and committing Solr-based secondary indexes.
- Migrations Completed
- Number of completed tasks from system methods that modified the schema.
- Misc. Tasks Completed
- Number of completed tasks from infrequently run operations, such as taking a snapshot or processing the notification of a completed replication.
- Read Requests Completed
- Number of completed read requests. Read requests read data off of disk and deserialize cached data.
- Read Repair Tasks Completed
- Number of read repair operations recently completed.
- Repl. on Write Tasks Completed
- Number of completed counter increment tasks that read then write on the replicas after a coordinator's local write. Depending on consistency level used on writes, tasks may back up outside of the normal write path.
- Request Responses Completed
- Number of completed callbacks executed after a task on a remote node is completed.
- Write Requests Completed
- Number of write requests received by the cluster that have been handled.
- Counter Mutation Requests Completed
- Number of counter mutation requests received by the cluster that have been handled.
- Memory Meter Completed
- Completed tasks that calculate the live ratio which is used to estimate memtable size. The live ratio is the actual memory usage of a memtable including JVM overhead as it compares it to the raw data size. There will be at most one pending task per table.
- Validation Executor Completed
- Completed tasks to read data from sstables and generate a merkle tree for a repair.
- Commitlog Archiver Completed
- Commitlog Archiver Completed
- Compaction Executor Completed
- Completed compactions.
- Pending Range Calculator Completed
- Completed tasks to calculate the ranges according to bootsrapping and leaving nodes.
- Native Transport Requests Requests Completed
- Native Transport Requests Requests Completed
- Flushes Blocked
- Number of memtables flush process blocked. A flush sorts and writes the memtables to disk, which could block writes.
- Gossip Tasks Blocked
- Number of gossip messages and acknowledgments blocked waiting to be sent or received.
- Hinted Handoff Blocked
- Number of hints blocked waiting to be delivered after a failed node comes up.
- Internal Responses Blocked
- Number of blocked tasks from internal tasks, such as nodes joining and leaving the cluster.
- Manual Repair Tasks Blocked
- Repair tasks blocked, such as handling the merkle tree transfer after the validation compaction.
- Memtable Post Flushers Blocked
- Number of blocked tasks related to the last step in flushing memtables to disk as SSTables. Includes removing unnecessary commitlog files and committing Solr-based secondary indexes.
- Migrations Blocked
- Number of blocked tasks from system methods that modified the schema.
- Misc. Tasks Blocked
- Number of blocked tasks from infrequently run operations, such as taking a snapshot or processing the notification of a completed replication.
- Read Requests Blocked
- Number of blocked read requests. Read requests read data off of disk and deserialize cached data.
- Read Repair Tasks Blocked
- Number of read repair operations blocked waiting to run.
- Repl. on Write Tasks Blocked
- Number of blocked counter increment tasks that will read then write on the replicas after a coordinator's local write. Depending on consistency level used on writes, tasks may back up outside of the normal write path.
- Request Responses Blocked
- Number of blocked callbacks to be executed after a task on a remote node is completed.
- Write Requests Blocked
- Number of write requests received by the cluster and blocked waiting to be handled.
- Counter Mutation Requests Blocked
- Number of counter mutation requests received by the cluster that are blocked and waiting to be handled.
- Memory Meter Blocked
- Memory Meter Blocked
- Validation Executor Blocked
- Validation Executor Blocked
- Commitlog Archiver Blocked
- Commitlog Archiver Blocked
- Compaction Executor Blocked
- Compaction Executor Blocked
- Pending Range Calculator Blocked
- Pending Range Calculator Blocked
- Native Transport Requests Requests Blocked
- Native Transport Requests Requests Blocked
- Total Flushes Blocked
- Total number of memtables flush process blocked. A flush sorts and writes the memtables to disk, which could block writes.
- Total Gossip Tasks Blocked
- Total number of gossip messages and acknowledgments blocked waiting to be sent or received.
- Total Hinted Handoff Blocked
- Total number of hints blocked waiting to be delivered after a failed node comes up.
- Total Internal Responses Blocked
- Total number of blocked tasks from internal tasks, such as nodes joining and leaving the cluster.
- Total Manual Repair Tasks Blocked
- Total repair tasks blocked, such as handling the merkle tree transfer after the validation compaction.
- Total Memtable Post Flushers Blocked
- Total number of blocked tasks related to the last step in flushing memtables to disk as SSTables. Includes removing unnecessary commitlog files and committing Solr-based secondary indexes.
- Total Migrations Blocked
- Total number of blocked tasks from system methods that modified the schema.
- Total Misc. Tasks Blocked
- Total number of blocked tasks from infrequently run operations, such as taking a snapshot or processing the notification of a completed replication.
- Total Read Requests Blocked
- Total number of blocked read requests. Read requests read data off of disk and deserialize cached data.
- Total Read Repair Tasks Blocked
- Total number of read repair operations blocked waiting to run.
- Total Repl. on Write Tasks Blocked
- Total number of blocked counter increment tasks that will read then write on the replicas after a coordinator's local write. Depending on consistency level used on writes, tasks may back up outside of the normal write path.
- Total Request Responses Blocked
- Total number of blocked callbacks to be executed after a task on a remote node is completed.
- Total Write Requests Blocked
- Total number of write requests received by the cluster and blocked waiting to be handled.
- Counter Mutation Requests Total Blocked
- Total number of counter mutation requests received by the cluster that are blocked and waiting to be handled.
- Total Memory Meter Blocked
- Total Memory Meter Blocked
- Total Validation Executor Blocked
- Total Validation Executor Blocked
- Total Commitlog Archiver Blocked
- Total Commitlog Archiver Blocked
- Total Compaction Executor Blocked
- Total Compaction Executor Blocked
- Total Pending Range Calculator Blocked
- Total Pending Range Calculator Blocked
- Total Native Transport Requests Requests Blocked
- Total Native Transport Requests Requests Blocked
- Task Queues
- Aggregate of thread pools pending queues that can be used to identify where things are backing up internally. This doesn't include pending compactions because it includes an estimate outside of the task queue or the hinted hand off queue, which can be in constant state of being on.
- Dropped Tasks
- Aggregate of different messages that might be thrown away.
- Dropped Counter Mutations
- Mutation was seen after the timeout (write_request_timeout_in_ms) so was thrown away. This client might have timed out before it met the required consistency level, but might have succeeded as well. Hinted handoffs and read repairs should resolve inconsistencies but a repair can ensure it.
- Dropped Mutations
- Mutation was seen after the timeout (write_request_timeout_in_ms) so was thrown away. This client might have timed out before it met the required consistency level, but might have succeeded as well. Hinted handoffs and read repairs should resolve inconsistencies but a repair can ensure it.
- Dropped Reads
- A local read request was received after the timeout (read_request_timeout_in_ms) so it was thrown away because it would have already either been completed and sent to client or sent back as a timeout error.
- Dropped Ranged Slice Reads
- A local ranged read request was received after the timeout (range_request_timeout_in_ms) so it was thrown away because it would have already either been completed and sent to client or sent back as a timeout error.
- Dropped Paged Range Reads
- A local paged read request was received after the timeout (request_timeout_in_ms) so it was thrown away because it would have already either been completed and sent to client or sent back as a timeout error.
- Dropped Request Responses
- A response to a request was received after the timeout (request_timeout_in_ms) so it was thrown away because it would have already either been completed and sent to client or sent back as a timeout error.
- Dropped Read Repairs
- The Mutation was seen after the timeout (write_request_timeout_in_ms) so was thrown away. With the read repair timeout, the node still exists in an inconsistent state.
- KeyCache Hits
- The number of key cache hits per second. This will avoid possible disk seeks when finding a partition in an SSTable.
- KeyCache Requests
- The number of key cache requests per second.
- KeyCache Hit Rate
- The percentage of key cache lookups that resulted in a hit.
- RowCache Hits
- The number of row cache hits per second.
- RowCache Requests
- The number of row cache requests per second.
- RowCache Hit Rate
- The percentage of row cache lookups that resulted in a hit.
- Native Clients
- The number of clients connected using the native protocol.
- Thrift Clients
- The number of clients connected via thrift.
- Read Repairs Attempted
- Number of read requests where the number of nodes queried possibly exceeds the consistency level requested in order to check for a possible digest mismatch.
- Asynchronous Read Repairs
- Corresponds to a digest mismatch that occurred after a completed read, outside of the client read loop.
- Synchronous Read Repairs
- Corresponds to the number of times there was a digest mismatch within the requested consistency level and a full data read was started.
- TBL: Local Writes
- Local write requests per second. Local writes update the table's memtable and appends to a commitlog.
- TBL: Local Write Latency
- Average response time to write data to a table's memtable and append to the commitlog. The elapsed time from when the replica receives the request from a coordinator and returns a response.
- TBL: Write Latency (Stacked)
- The min, median, max, 90th, and 99th percentile of the response times to write data to a table's memtable and append to the commitlog. The elapsed time from when the replica receives the request from a coordinator and returns a response.
- TBL: Local Reads
- Local read requests per second. Local reads retrieve data from a table's memtable and any necessary SSTables on disk.
- TBL: Local Read Latency
- Average response time to read data from the memtable and SSTables for a specific table. The elapsed time from when the replica receives the request from a coordinator and returns a response.
- TBL: Read Latency (Stacked)
- The min, median, max, 90th, and 99th percentile of the response time to read data from the memtable and sstables for a specific table. The elapsed time from when the replica receives the request from a coordinator and returns a response.
- TBL: Live Disk Used
- Disk space used by live SSTables. There might be obsolete SSTables not included.
- TBL: Total Disk Used
- Disk space used by a table by SSTables, including obsolete ones waiting to be garbage collected.
- TBL: SSTable Count
- Total number of SSTables for a table.
- TBL: SSTables per Read (Stacked)
- The min, median, max, 90th, and 99th percentile of how many SSTables are accessed during a read.
- TBL: Cell Count
- The min, median, max, 90th, and 99th percentile of how many cells exist in partitions for this table.
- TBL: Partition Size
- The min, median, max, 90th, and 99th percentile of the size (in bytes) of partitions of this table.
- TBL: Pending Reads/Writes
- Estimate of the number of mutation threads blocked on a memtable flush or truncate.
- TBL: Bloom Filter Space Used
- The total size of all the SSTables' bloom filters for this table.
- TBL: Bloom Filter False Positives
- Number of bloom filter false positives per second.
- TBL: Bloom Filter False Positive Ratio
- Percentage of bloom filter lookups that resulted in a false positive.
- TBL: Bloom Filter Off Heap
- Total off heap memory used by bloom filters from all live SSTables in a table.
- TBL: Index Summary Off Heap
- Total off heap memory used by the index summary of all live SSTables in a table.
- TBL: Compression Metadata Off Heap
- Total off heap memory used by the compression metadata of all live SSTables in a table.
- TBL: Memtable Off Heap
- Off heap memory used by a table's current memtable.
- TBL: Total Memtable Size
- An estimate of the space used in memory (including JVM overhead) for all memtables. This includes ones that are currently being flushed and related secondary indexes.
- TBL: Total Memtable Heap Size
- An estimate of the space used in JVM heap memory for all memtables. This includes ones that are currently being flushed and related secondary indexes.
- TBL: Total Memtable Live Data Size
- An estimate of the space used for 'live data' (off-heap, excluding overhead) for all memtables. This includes ones that are currently being flushed and related secondary indexes.
- TBL: Total Memtable Off-Heap Size
- An estimate of the space used in off-heap memory for all memtables. This includes ones that are currently being flushed and related secondary indexes.
- Search: Requests
- Requests per second made to a specific Solr core/index.
- Search: Request Latency
- Average time a search query takes in a DSE cluster using DSE Search.
- Search: Errors
- Errors per second that occur for a specific Solr core/index.
- Search: Timeouts
- Timeouts per second on a specific Solr core/index.
- Search: Core Size
- Size of the Solr core on disk.
- In-Memory Percent Used
- The percentage of memory allocated for in-memory tables currently in use.
- OS: Memory (stacked)
- Stacked graph of used, cached, and free memory.
- OS: Memory (stacked)
- Stacked graph of used and free memory.
- OS: Memory (stacked)
- Stacked graph of committed, cached, paged, non-paged, and free memory.
- OS: Memory Free
- Total system memory currently free.
- OS: Memory Used
- Total system memory currently used.
- OS: Memory Buffered
- Total system memory currently buffered.
- OS: Memory Cached
- Total system memory currently cached.
- OS: Memory Available
- Available physical memory.
- OS: Memory Committed
- Memory in use by the operating system.
- OS: Pool Paged Resident Memory
- Allocated pool-paged-resident memory.
- OS: Pool Nonpaged Memory
- Allocated pool-nonpaged memory.
- OS: System Cache Resident Memory
- Memory used by the file cache.
- OS: CPU (stacked)
- Stacked graph of iowait, steal, nice, system, user, and idle CPU usage.
- OS: CPU (stacked)
- Stacked graph of idle, user, and system CPU usage.
- OS: CPU (stacked)
- Stacked graph of user, privileged, and idle CPU usage.
- OS: CPU User
- Time the CPU devotes to user processes.
- OS: CPU System
- Time the CPU devotes to system processes.
- OS: CPU Idle
- Time the CPU is idle.
- OS: CPU Iowait
- Time the CPU devotes to waiting for I/O to complete.
- OS: CPU Steal
- Time the CPU devotes to tasks stolen by virtual operating systems.
- OS: CPU Nice
- Time the CPU devotes to processing nice tasks.
- OS: CPU Privileged
- Time the CPU devotes to processing privileged instructions.
- OS: Load
- Operating system load average.
- OS: Disk Usage (%)
- Disk space used by Cassandra at a given time.
- OS: Disk Free
- Free space on a specific disk partition.
- OS: Disk Used
- Disk space used by Cassandra at a given time.
- OS: Disk Read Throughput
- Average disk throughput for read operations.
- OS: Disk Write Throughput
- Average disk throughput for write operations.
- OS: Disk Throughput
- Average disk throughput for read and write operations.
- OS: Disk Read Rate
- Rate of reads per second to the disk.
- OS: Disk Writes Rate
- Rate of writes per second to the disk.
- OS: Disk Latency
- Average completion time of each request to the disk.
- OS: Disk Request Size
- Average size of read requests issued to the disk.
- OS: Disk Request Size
- Average size of read requests issued to the disk.
- OS: Disk Queue Size
- Average number of requests queued due to disk latency issues.
- OS: Disk Utilization
- CPU time consumed by disk I/O.
- OS: Net Received
- Speed of data received from the network.
- OS: Net Sent
- Speed of data sent across the network.