OpsCenter Workspace Overview
Introduces the major areas of functionality available in the OpsCenter workspace.
The OpsCenter workspace overview introduces the major areas of functionality available from the menus in the OpsCenter UI.
Main menu
The main menu and Cluster Actions menu are available at the top of the UI in every functional area within OpsCenter:
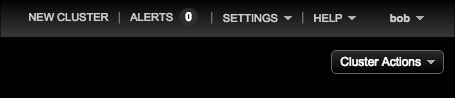
Access the following OpsCenter features from the main menu:
- New Cluster - Create a new cloud cluster or local cluster, or add an existing cluster to manage within OpsCenter.
- Alerts - Configure alert thresholds for a number of Cassandra cluster-wide, table, and operating system metrics. Available for DataStax Enterprise clusters only.
- Settings - Access to editing Cluster Connections and User
Roles:
- Cluster Connections - Modify cluster settings or remove the cluster from OpsCenter.
- Users & Roles - Manage users with role-based authentication.
- Help - Information resources for OpsCenter. Clicking Help Center opens the current DataStax documentation. Clicking Feedback opens a form for sending feedback to the OpsCenter team. Clicking Report generates a PDF report with information on the managed clusters. Clicking Diagnostics downloads a tarball that contains diagnostic information about the nodes in a cluster.
- Username - If authentication is enabled, the username for the currently logged in user is displayed. Click your username to change your password or to log out of OpsCenter.
Navigation menu
The left navigation pane provides a link to the Overview section and lists the clusters in the OpsCenter instance. The navigation menu provides access to the functional areas within the OpsCenter UI, such as Nodes, Activities, Data, and Services.
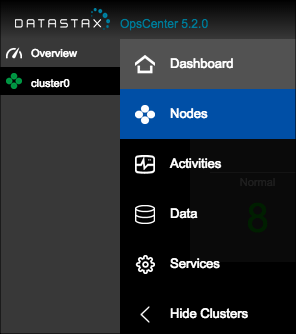
The OpsCenter UI is divided into the following functional areas:
- Overview - Provides a high-level overview of the clusters and activity within an OpsCenter instance. Displays any active alerts and a summary box for each cluster managed by OpsCenter. The Cluster Actions menu is not available from the Overview because it is a summary of all clusters in an OpsCenter instance.
- Dashboard - View information about the clusters managed by OpsCenter and monitor a number of Cassandra cluster performance metrics. Real-time and historical performance metrics are available at different granularities: cluster-wide, per node, or per table. Organize your dashboards using presets, which you can also export and import into other OpsCenter instances on other machines. Update notifications for upgrades to DataStax Enterprise or Cassandra are also displayed in the Dashboard.
- Nodes - View your cluster from different perspectives (Ring or List View) and perform certain maintenance operations on cluster nodes.
- Activities - Displays all running tasks in the cluster. When tasks are running, the Activities icon displays a badge with the number of currently running tasks. View the most recent OpsCenter log events, such as OpsCenter startup and shutdown, in the Event Log. View the status of Spark jobs. View the status of Hadoop analytics jobs under Hadoop Jobs.
- Data - Manage keyspaces and tables (column families) within those keyspaces.
- Services - Enable DataStax Enterprise Management Services; including the Backup, Repair, Capacity, Best Practice, and Performance services.
- Hide/Show Clusters - Toggle to hide or show the list of clusters in the left navigation pane.