About DSE Performance Service
The DSE Performance Service automatically collects and organizes performance diagnostic information into a set of data dictionary tables that can be queried with CQL.
The DataStax Enterprise Performance Service automatically collects
and organizes performance diagnostic information from Cassandra, DSE Search, and DSE Analytics into a set of data dictionary tables. These tables
are stored in the dse_perf keyspace and can be queried with CQL using any
CQL-based utility, such as cqlsh, DataStax DevCenter, or any application using a Cassandra CQL driver.
- Identify slow queries on a cluster to easily find and tune poorly performing queries.
- View latency metrics for tables on all user (non-system) keyspaces.
- Collect per node and cluster wide lifetime metrics by table and keyspace.
- Obtain recent and lifetime statistics about tables, such as the number of SSTables, read/write latency, and partition (row) size.
- Track read/write activity on a per-client, per-node level for both recent and long-lived activity to identify problematic user and table interactions.
- Detect bottlenecks in DSE Search.
- Monitor the resources used in a DSE Analytics cluster.
- Monitor particular DSE Analytics applications.
The OpsCenter Performance Service provides visual monitoring of diagnostics collected through the DSE Performance Service, displays alerts, and provides recommendations for optimizing cluster performance.
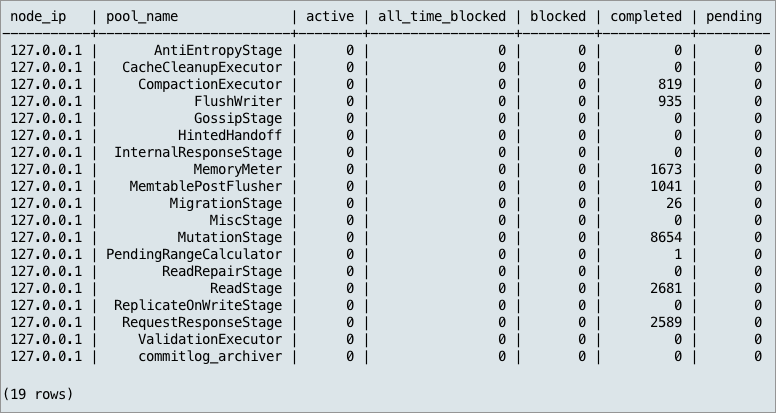
The following is sample output from querying thread pool statistics:
cqlsh:dse_perf> select * from thread_pool;Result: