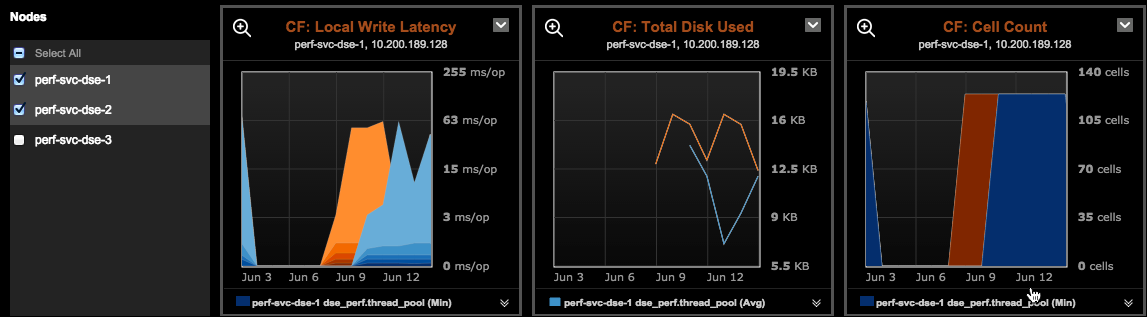
Viewing table metrics
View concentrated table metrics and charts thereof, along with alerts and recommendations for improving table performance.
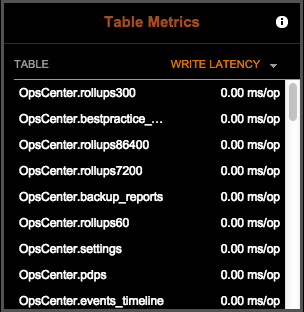
View concentrated table metrics and charts thereof, along with alerts and recommendations for improving table performance. Table (column family) metrics are pre-populated in the lower half of the Table Metrics Performance page.
Procedure
-
Click the title bar of the Table Metrics panel.
 The Table Metrics performance page appears.
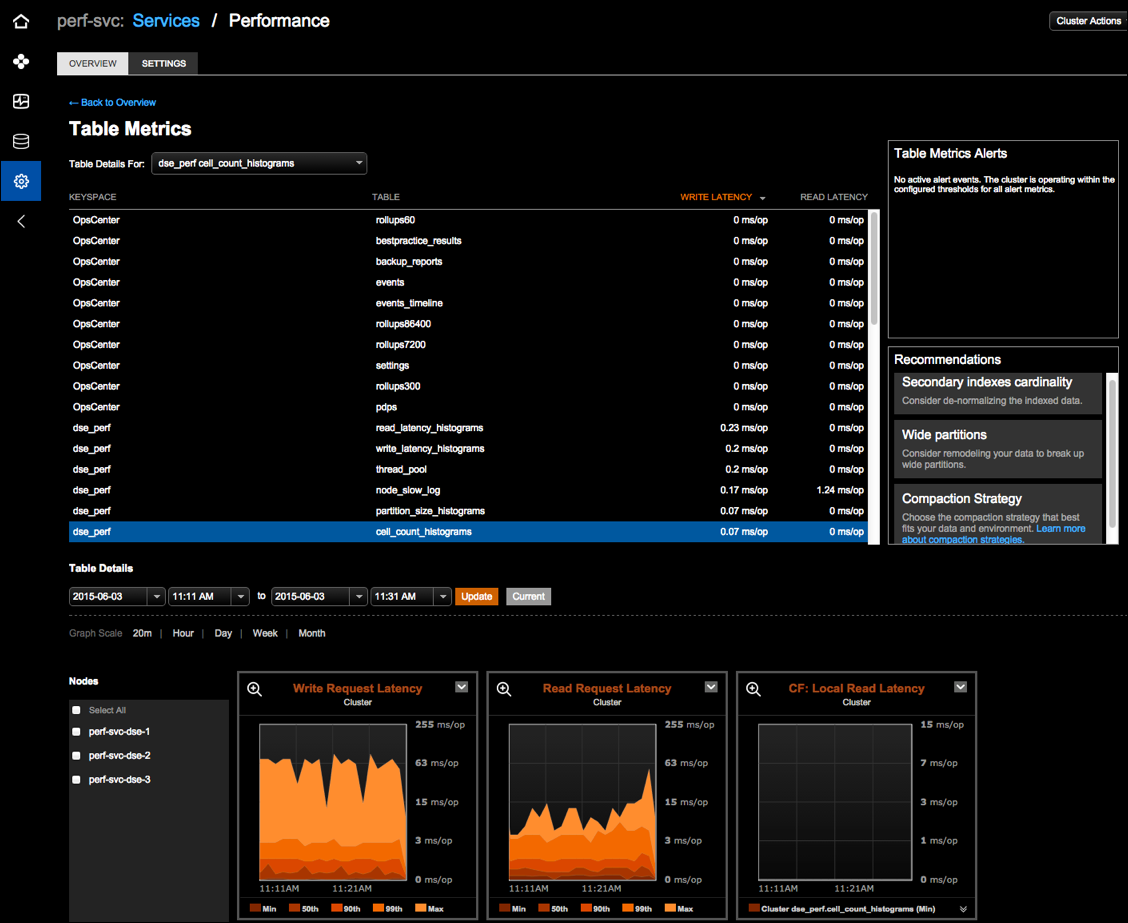
-
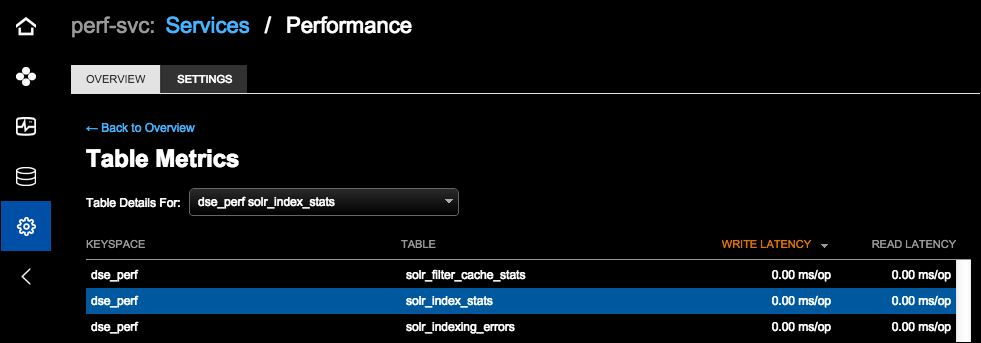
Select an option from the Table Details For list. The
Table Metrics view updates and highlights the associated table row.
-
The Table Metrics performance details page provides multiple viewing
options:
- Date and time range: Select the date and time and click Update. Click Current to view real-time data.
- Time Range: Select the granularity for the data that displays in the metrics charts. Available options are by 20 minutes, Hour, Day, Week, or Month.
- By default, all nodes are shown. Select a specific node from the
Node list. Select a few nodes to view a visual
side-by-side comparison.