Tracing slow queries
Trace identified slow queries to view the stages in a query and determine where performance bottlenecks occur. Trace ad hoc CQL queries.
Trace slow queries to view the stages in a query and determine where performance bottlenecks occur.
Prerequisites
Access to the trace query feature in OpsCenter requires permission granted to a user role. Those users with the admin role have full privileges.
Warning: When initially accessing the Slow Query console, a warning dialog
informs you of potential consequences to data or performance when tracing queries.
Review the information, select I Understand and click
Close to continue.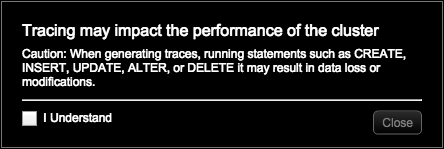
Procedure
-
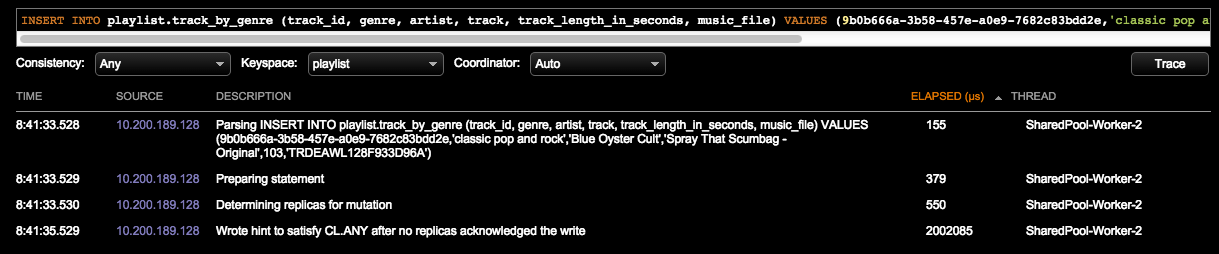
Click Trace.
The query executes and displays each stage in the query, including timestamp and elapsed time in microseconds. To view the longest running stages of the query, sort the query by the Elapsed Time column. IP addresses for any nodes in the Source list are highlighted in red.