Configuring the slow query log
Configure the slow query log in the OpsCenter Performance Service. OpsCenter records any queries that take longer than the configured threshold.
Configure the slow query log parameters in the Performance Service. Examine the slow query log to identify and track queries that take an excessive time to execute. Slow queries are candidates for performance optimization. When the slow query log is enabled, OpsCenter records any queries that take longer than the allotted threshold. By default, the slow query log is enabled in DataStax Enterprise.
Prerequisites
dse_perf keyspace. The default value might need to be
increased. Click . 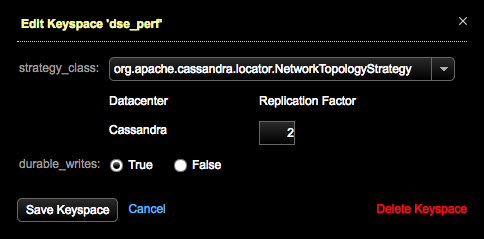
Procedure
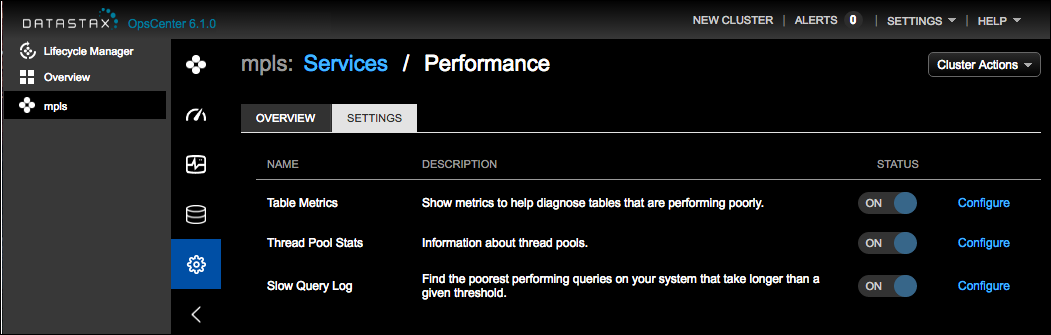
- Click .
- Click the Configure or Details link as appropriate for the Performance Service.
-
Click the Settings tab.
-
Click the Configure link for the Slow Query Log.
The Configure Slow Query Log dialog appears.
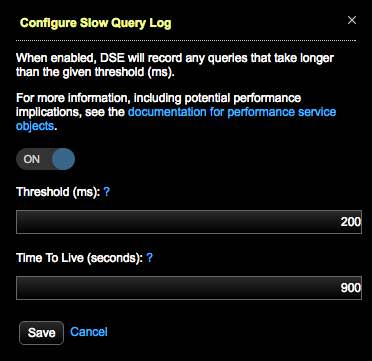
- Click the button to the On position.
- Optional:
Enter a Threshold value to override the default (200
ms). To prevent excess overhead, the threshold must be higher than 15 ms.
Queries that take longer than the allotted threshold value are recorded in the
node_slow_log table in the
dse_perfkeyspace.The CQL for the node_slow_log table can be viewed in the Data area of OpsCenter Monitoring:
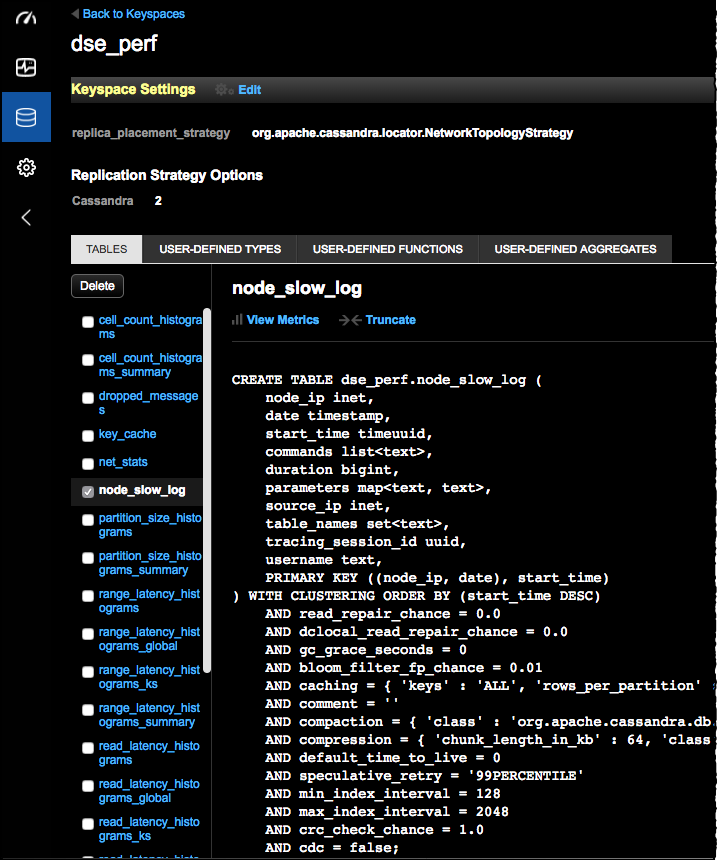
For information about each column, see CQL slow log table. For more information about collecting and exporting slow queries using CQL, see Collecting slow queries.
- Optional: Enter a TTL in Time To Live (TTL) to override the default (900 seconds). The TTL indicates the amount of time to wait before automatically deleting the record of the slow query from the database.
- Click Save.