Tracing slow queries
Trace identified slow queries to view the stages in a query and determine where performance bottlenecks occur. Trace ad hoc CQL queries.
Trace slow queries to view the stages in a query and determine where performance bottlenecks occur.
Prerequisites
Access to the trace query feature in OpsCenter requires permission granted to a user role. Those users with the admin role have full privileges.
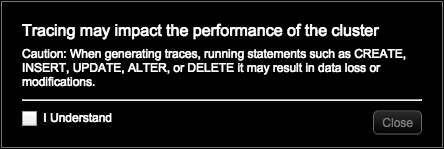
Warning: When initially accessing the Slow Query console, a warning dialog
informs you of potential consequences to data or performance when tracing queries.
Review the information, select I Understand and click
Close to continue.
Procedure
- Click .
-
Click the Configure link for the Performance Service.
The Overview tab displays the performance panels.
- Click the Slow Queries panel.
-
Select a query from the Slow Queries list.
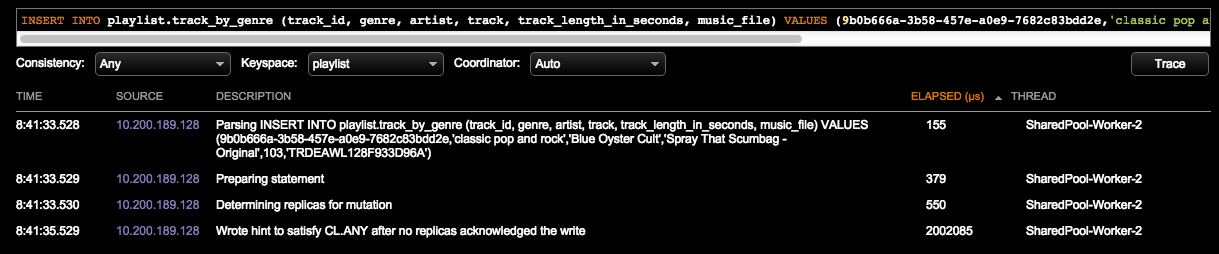
The CQL query appears with syntax highlighting in the query box. Selecting a query from the list automatically selects the keyspace for the query.
-
Click Trace.
The query executes and displays each stage in the query, including timestamp and elapsed time in microseconds. To view the longest running stages of the query, sort the query by the Elapsed Time column. IP addresses for any nodes in the Source list are highlighted in red.
-
To make adjustments to the query, select an option from the
Consistency or Coordinator
lists and experiment with running additional traces.
Generally, selecting a keyspace is not applicable to tracing a query selected from the Slow Queries list because that was already done for that query. If you have tables named the same but located in different keyspaces, select the Keyspace to trace. The Slow Queries excludes system or OpsCenter keyspaces.
-
To run an ad hoc query:
- Enter the CQL statement directly in the query box.
- Make any selections from the Consistency, Keyspace, or Coordinator lists.
- Click Trace.