Getting statistics and metrics
Understanding the performance characteristics of a cluster is critical to diagnosing issues and planning capacity. Use DataStax tools and a Java Console (JConsole) to get node and cluster statistics.
DataStax Enterprise (DSE) exposes a number of statistics and management operations via Java Management Extensions (JMX). JMX is a Java technology that supplies tools for managing and monitoring Java applications and services. Any statistic or operation that a Java application has exposed as an MBean can then be monitored or manipulated using JMX.
During normal operation, the database outputs information and statistics that you can monitor using JMX-compliant tools, such as:
Using the same tools, you can perform certain administrative commands and operations such as flushing caches or doing a node repair.
DataStax recommends using DSE Metrics Collector or DSE OpsCenter to monitor clusters and view metrics. These tools provide valuable insights into your clusters by visually representing the most useful metrics in customizable dashboards.
Listing MBean names
To make calls to MBeans from command line or set permissions in CQL, first get the complete name of the MBean.
Following is an example of how to use jmxterm to dump the full list of JMX MBeans from a database node:
echo "beans" | java -jar jmxterm-1.0.0-uber.jar -l localhost:7199 -n 2>&1|
Only perform this operation once because the list can be large or search MBeans with particular names in the output by redirecting the result to another filter.
For example to find MBeans that contain the word |
The results provide the exact MBean strings to use in nodetool sjk mx command, when searching for a specific metric in JConsole, or when managing permissions with the CQL GRANT and REVOKE commands.
com.datastax.bdp.advrep.v2.metrics:name=CommitLogMessagesRead,type=ReplicationLog
          com.datastax.bdp.advrep.v2.metrics:name=CommitLogsDeleted,type=ReplicationLog
          com.datastax.bdp.advrep.v2.metrics:name=CommitLogsToConsume,type=ReplicationLog
          org.apache.cassandra.db:type=Commitlog
          org.apache.cassandra.metrics:name=CompletedTasks,type=CommitLog
          org.apache.cassandra.metrics:name=PendingTasks,type=CommitLog
          org.apache.cassandra.metrics:name=TotalCommitLogSize,type=CommitLog
          org.apache.cassandra.metrics:name=WaitingOnCommit,type=CommitLog
          org.apache.cassandra.metrics:name=WaitingOnSegmentAllocation,type=CommitLog
Using JConsole
JConsole is a JMX-compliant tool for monitoring Java applications. JConsole consumes the JMX metrics and operations exposed by DSE and displays them in a well-organized GUI.
|
If you choose to monitor DSE using JConsole, understand that JConsole consumes a significant amount of system resources. For this reason, DataStax recommends running JConsole on a remote machine rather than on the same host as a DSE node. |
Installing JConsole and connecting to a node
-
Configure JMX authentication if you need to authenticate JMX users and role-based access control to MBeans. See Configuring JMX authentication for DSE.
-
Start JConsole from a terminal, which opens the JConsole GUI:
jconsoleJConsole is included with Sun JDK 5.0 and later, and is also included in OpenJDK. For the latest JDK installation guides, see the Oracle or OpenJDK documentation.
-
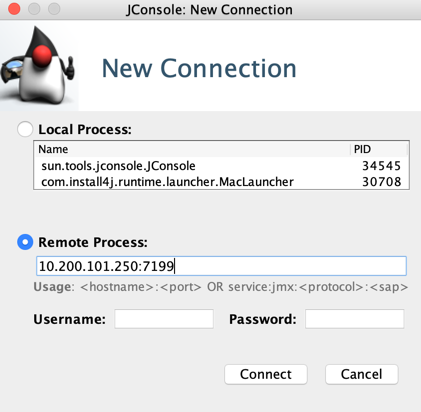
In the JConsole GUI, select Remote Process and enter the IP address and the port of the node you want to connect to. By default, the DSE JMX metrics monitoring port is 7199.
-
Optional: Enter the username and password for the node you are connecting to.
-
Click Connect to connect to your node.
-
In the JConsole GUI, click the MBeans tab.
-
In the left navigation, click org.apache.cassandra.metrics to display all DSE metrics.
Viewing metrics in JConsole
For each node monitored, JConsole provides tab views. The Overview and Memory tabs contain information that is very useful for developers. The Memory tab allows you to compare heap and non-heap memory usage, and provides a control to immediately perform Java garbage collection.
- Overview
-
Displays overview information about the Java VM and monitored values.
- Memory
-
Displays information about memory use.
- Threads
-
Displays information about thread use.
- Classes
-
Displays information about class loading.
- VM Summary
-
Displays information about the Java Virtual Machine (VM).
- MBeans
-
Displays information about MBeans.
For specific database metrics and operations, the most important area of JConsole is the MBeans tab. This tab lists the following MBeans:
- org.apache.cassandra.auth
-
Includes permissions cache.
- org.apache.cassandra.db
-
Includes caching, table metrics, and compaction.
- org.apache.cassandra.internal
-
Internal server operations such as gossip, hinted handoff, and Memtable values.
- org.apache.cassandra.metrics
-
Includes metrics on CQL, clients, keyspaces, read repair, storage, threadpools, and other topics.
- org.apache.cassandra.net
-
Internode communication including FailureDetector, MessagingService, and StreamingManager.
- org.apache.cassandra.request
-
Tasks related to read, write, and replication operations.
- org.apache.cassandra.service
-
Includes GCInspector.
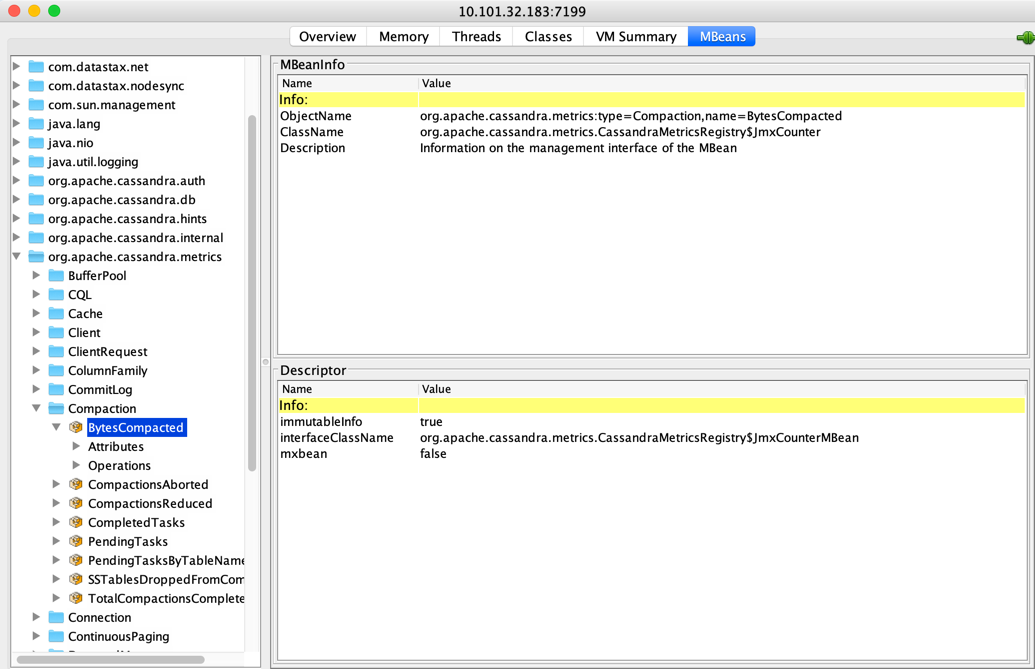
When you select an MBean in the tree, its MBeanInfo and MBean Descriptor are displayed on the right, and any attributes, operations or notifications appear in the tree below it. For example, selecting and expanding the org.apache.cassandra.metrics MBean to view available actions available metrics displays the following information:
Using nodetool
The nodetool utility is a command-line interface for monitoring a cluster and performing routine database operations. It is typically run from an operational node.
The nodetool utility provides commands for viewing detailed metrics for tables, server metrics, and compaction statistics:
-
nodetool tablestatsdisplays statistics for each table and keyspace. -
nodetool tablehistogramsprovides statistics about a table, including read/write latency, row size, column count, and number of SSTables. -
nodetool netstatsprovides statistics about network operations and connections. -
nodetool tpstatsprovides statistics about the number of active, pending, and completed tasks for each stage of database operations by thread pool.
This example shows the output from nodetool proxyhistograms after running 4,500 insert statements and 45,000 select statements on a three ccm node-cluster on a local computer.
nodetool proxyhistogramsproxy histograms
Percentile Read Latency Write Latency Range Latency
(micros) (micros) (micros)
50% 1502.50 375.00 446.00
75% 1714.75 420.00 498.00
95% 31210.25 507.00 800.20
98% 36365.00 577.36 948.40
99% 36365.00 740.60 1024.39
Min 616.00 230.00 311.00
Max 36365.00 55726.00 59247.00For a summary of the ring and its current state of general health, use nodetool status.
For example:
nodetool statusNote: Ownership information does not include topology; for complete information, specify a keyspace
Datacenter: datacenter1
=======================
Status=Up/Down
|/ State=Normal/Leaving/Joining/Moving
-- Address Load Tokens Owns Host ID Rack
UN 127.0.0.1 47.66 KB 1 33.3% aaa1b7c1-6049-4a08-ad3e-3697a0e30e10 rack1
UN 127.0.0.2 47.67 KB 1 33.3% 1848c369-4306-4874-afdf-5c1e95b8732e rack1
UN 127.0.0.3 47.67 KB 1 33.3% 49578bf1-728f-438d-b1c1-d8dd644b6f7f rack1Using nodetool sjk
Nodetool includes the open source Swiss Java Knife as a built-in command nodetool sjk for troubleshooting.
This section focuses on using the mx subcommand to get and set JMX MBean values and interact with a specific list of MBeans.
To learn more about SJK, see the jvm-tools Github repository.
|
The Run the |
Getting the MBean options and values
Use the MBean information option to show available values.
For example, after listing MBean names to show the options available for TotalCommitLogSize, use the complete name in the nodetool sjk mx command:
nodetool sjk mx -b "org.apache.cassandra.metrics:name=TotalCommitLogSize,type=CommitLog" -miorg.apache.cassandra.metrics:type=CommitLog,name=TotalCommitLogSize
org.apache.cassandra.metrics.CassandraMetricsRegistry$JmxGauge
- Information on the management interface of the MBean
(A) Value : java.lang.Object
- Attribute exposed for management
(O) objectName() : javax.management.ObjectName
- Operation exposed for managementThe MBean has a simple value. To read the single number, run the following command:
nodetool sjk mx -b "org.apache.cassandra.metrics:name=TotalCommitLogSize,type=CommitLog" -f Value -mgorg.apache.cassandra.metrics:type=CommitLog,name=TotalCommitLogSize
67108864|
SJK is case-sensitive, enter the names exactly. |
To check on a more complex metric such as latency, find out how many values are available by using -mi option:
nodetool sjk mx -b "org.apache.cassandra.metrics:name=Latency,scope=Read,type=ClientRequest" -miorg.apache.cassandra.metrics:type=ClientRequest,scope=Read,name=Latency
org.apache.cassandra.metrics.CassandraMetricsRegistry$JmxTimer
- Information on the management interface of the MBean
(A) Max : double
- Attribute exposed for management
(A) Min : double
- Attribute exposed for management
(A) Mean : double
- Attribute exposed for management
(A) StdDev : double
- Attribute exposed for management
(A) 95thPercentile : double
- Attribute exposed for management
(A) DurationUnit : String
- Attribute exposed for management
(A) 50thPercentile : double
- Attribute exposed for management
(A) 75thPercentile : double
- Attribute exposed for management
(A) 98thPercentile : double
- Attribute exposed for management
(A) 99thPercentile : double
- Attribute exposed for management
(A) 999thPercentile : double
- Attribute exposed for management
(A) OneMinuteRate : double
- Attribute exposed for management
(A) FifteenMinuteRate : double
- Attribute exposed for management
(A) FiveMinuteRate : double
- Attribute exposed for management
(A) MeanRate : double
- Attribute exposed for management
(A) RateUnit : String
- Attribute exposed for management
(A) Count : long
- Attribute exposed for management
(O) values() : long[]
- Operation exposed for management
(O) objectName() : javax.management.ObjectName
- Operation exposed for managementThen to read out a single value from this metric, use the following command:
nodetool sjk mx -b "org.apache.cassandra.metrics:name=Latency,scope=Read,type=ClientRequest" -f 99thPercentile -mgorg.apache.cassandra.metrics:type=ClientRequest,scope=Read,name=Latency
3379.391