Running the Weather Sensor demo
The Weather Sensor demo compares how long it takes to run Spark SQL queries against aggregated data for a number of weather sensors in various cities.
Using the Weather Sensor demo, you can compare how long it takes to run Spark SQL queries against aggregated data for a number of weather sensors in various cities. For example, you can view reports using different metrics, such as temperature or humidity, and get a daily roll up.
You run customize Spark SQL queries using different metrics and different dates. In addition to querying CQL tables, you time Spark SQL queries against data in DataStax Enterprise File System (DSEFS).
Prerequisites
Before running the demo, install the following source code and tools if you do not already have them:
- Python 2.7:
- Debian and Ubuntu
sudo apt-get install python2.7-dev
- RedHat or CentOS
sudo yum install python27
- Mac OS X already has Python 2.7 installed.
- Debian and Ubuntu
pipinstaller tool:- Debian and Ubuntu
sudo apt-get install python-pip
- RedHat or CentOS
sudo yum install python-pip
- Mac OS X
sudo easy_install pip
- Debian and Ubuntu
- The
libsasl2-devpackage:- Debian and Ubuntu
sudo apt-get install libsasl2-dev
- RedHat or CentOS
sudo yum install cyrus-sasl-lib
- Debian and Ubuntu
- The required Python packages:
- All platforms
sudo pip install pyhs2 six flask cassandra-driver
- All platforms
If you installed DataStax Enterprise using a tarball, set the PATH
environment variable to the DataStax Enterprise installation /bin
directory.
export PATH=$PATH:installation_location/binStart DataStax Enterprise and import data
You start DataStax Enterprise in Spark mode, and then run a script that creates the schema for weather sensor data model. The script also imports aggregated data from CSV files into DSE tables. The script uses thehadoop fs command to put the CSV files into the DSEFS.- Start DataStax Enterprise in Spark mode.
- Run the create-and-load CQL script in the
demos/weather_sensors/resources directory. On
Linux, for example:
cd installation_location/demos/weather_sensors &&
bin/create-and-load
The default location of the demos directory depends on the type of installation:- Package installations: /usr/share/dse/demos
- Tarball installations: installation_location/demos
The output confirms that the script imported the data into CQL and copied files to DSEFS.
PATH as described in Prerequisites, and retry. Starting the Spark SQL Thrift server
You start the Spark SQL Thrift server on a specific port to avoid conflicts. Start using
your local user account. Do not use sudo.
- Start the Spark SQL Thrift server on port 5588. On Linux, for example:
cd installation_location &&
dse spark-sql-thriftserver start --hiveconf hive.server2.thrift.port=5588
Start the web app and query the data
- Open another terminal and start the Python service that controls the web interface:
cd installation_location/demos/weather_sensors && python web/weather.py - Open a browser and go to the following URL:
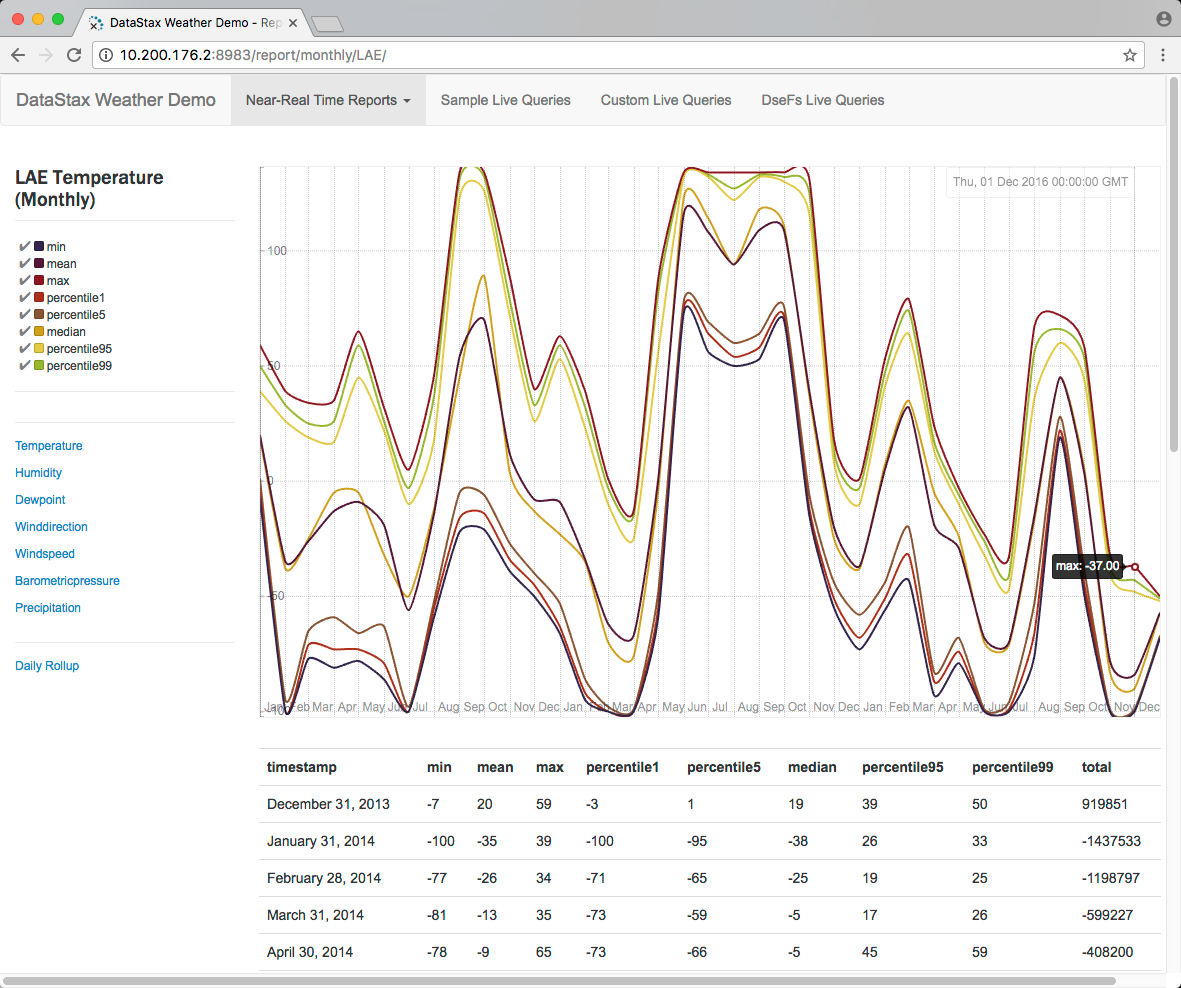
http://localhost:8983/The weather sensors app appears. Select Near Real-Time Reports on the horizontal menu. A drop-down listing weather stations appears:

- Select a weather station from the drop-down, view the graph, and select different metrics from the vertical menu on the left side of the page.
- On the horizontal menu, click Sample Live Queries, then select
a sample script. Click the Spark SQL button, then click
Submit.
The time spent loading results using Spark appears.
 Note: If you are running the demo on a SearchAnalytics datacenter, port 8983 conflicts with the Search web UI. Change the port in the demos/weather_sensors/web/weather.py to a free port.
app.run(host='0.0.0.0', port=8984, threaded=True, debug=True)
- From the horizontal menu, click Custom Live Queries. Click a Week Day, and then a metric, such as Wind Direction. Click Recalculate Query. The query reflects the selections you made.
- From the horizontal menu, click DSEFS Live Queries. Click Submit query. The time spent
loading results from DSEFS using Spark SQL appears.

Clean up
To remove all generated data, run the following commands:
cd installation_location/demos/weather_sensors &&
bin/cleanupcqlsh -e "DROP KEYSPACE weathercql;"