Logs
Mission Control provides centralized logging in its control plane. A centralized location allows querying for errors, monitoring messages, and finding root causes to issues.
-
KOTS installation
-
Helm installation
For KOTS-based installations, you configure logging during the installation of Mission Control.
For Helm-based installations, you configure logging through the values.yaml file.
The key components for log collection are:
-
loki: Configures the Loki log aggregation system -
aggregator: Configures the Vector aggregator that processes and forwards logs -
agent: Configures the Vector agent that collects logs from nodes
For detailed configuration options, see Install Mission Control with Helm.
Architecture
Mission Control aggregates, indexes, stores, and accesses logs with queries.
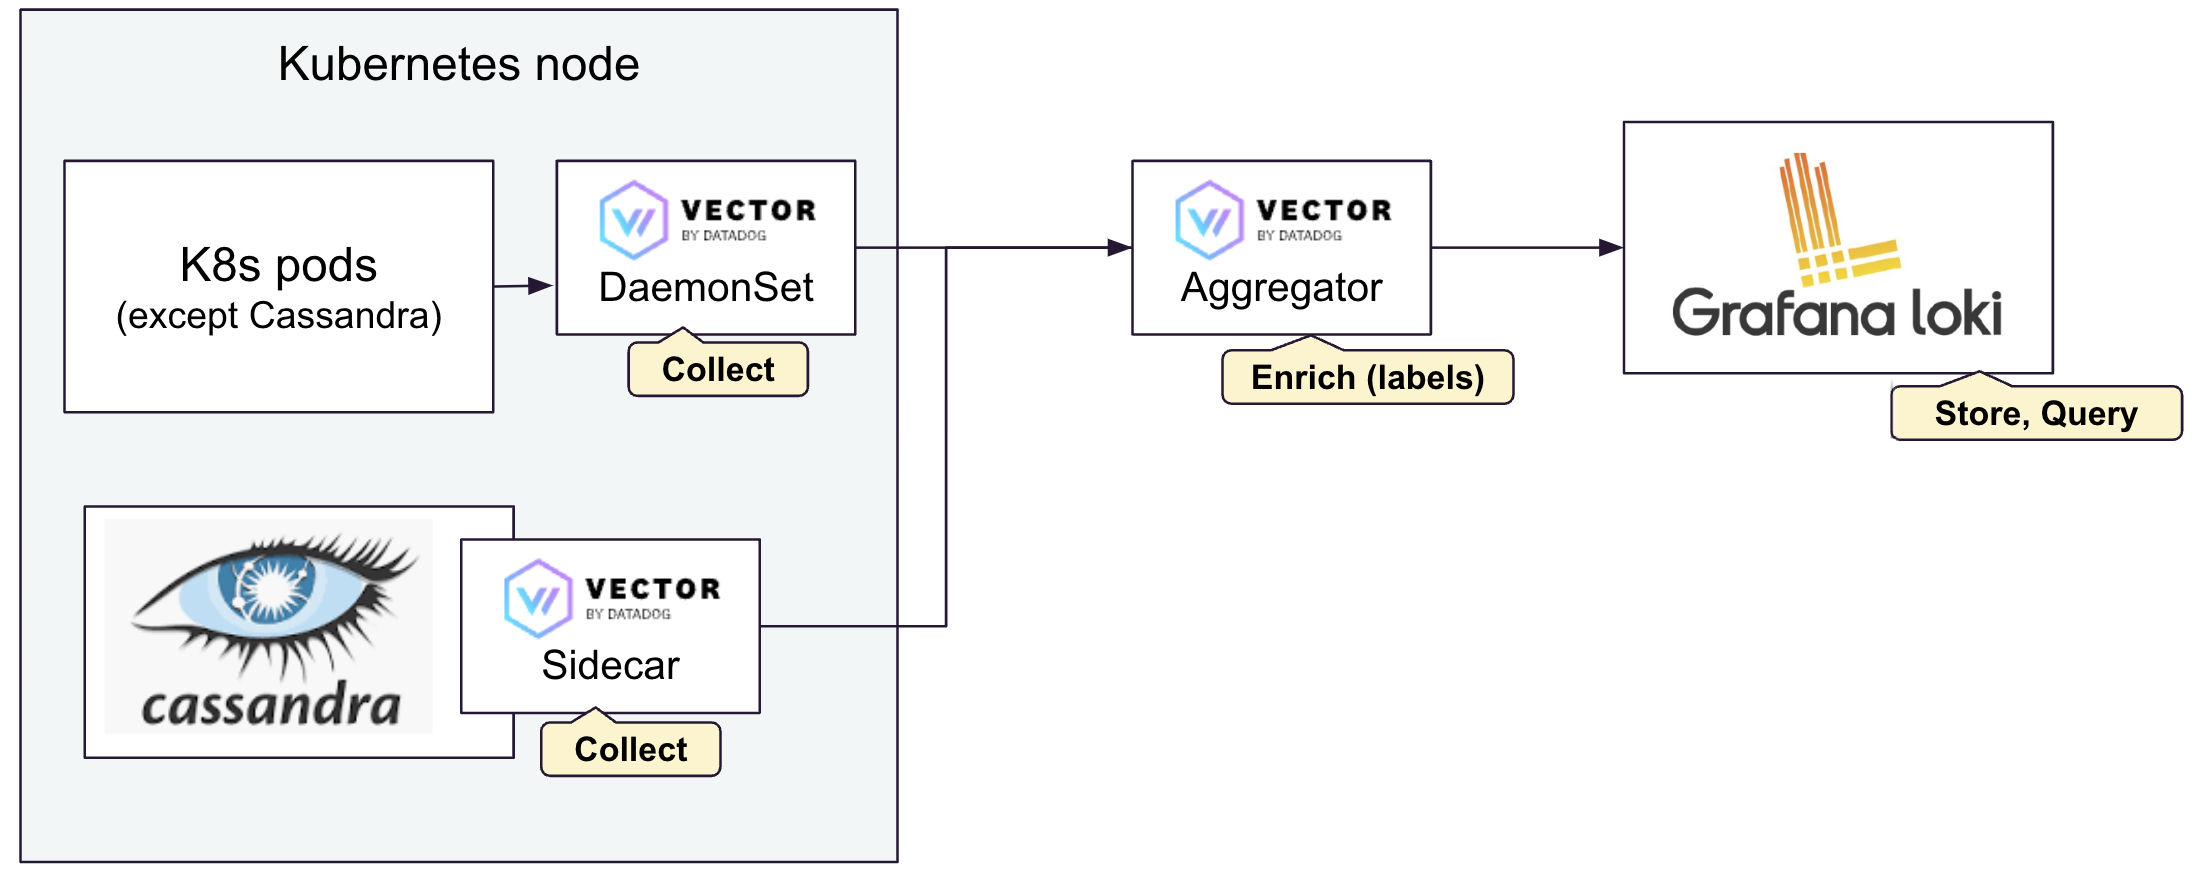
A Vector DaemonSet on each Kubernetes node actively scrapes the logs from the local pods.
Apache Cassandra®, DataStax Enterprise (DSE), and Hyper-Converged Database (HCD) pods monitor the logs on their pods through a Vector Sidecar.
Nodes added to racks, datacenters, and clusters are automatically discovered and scraped for logging and metric information.
-
KOTS configuration
-
Helm configuration
For KOTS-based installations, the system automatically configures the logging architecture during the KOTS installation process.
For Helm installations, you configure the logging architecture through the values.yaml file.
Key configuration sections include:
loki:
  enabled: true
  loki:
    storage:
      bucketNames:
        chunks: my_loki_chunks_bucket
      limits_config:
        retention_period: 7d
  read:
    persistence:
      enabled: true
      size: 10Gi
    replicas: 1
  write:
    persistence:
      enabled: true
      size: 10Gi
    replicas: 1
  backend:
    replicas: 1

aggregator:
  enabled: true
  customConfig:
    sinks:
      loki:
        type: loki
        inputs: [vector_with_defaults, syslog]
        endpoint: "http://loki-gateway"
        tenant_id: anonymous
        out_of_order_action: accept
        labels:
          source_type: '{{ "{{\" }} source_type {{ \"}}" }}'
          namespace: '{{ "{{\" }} namespace {{ \"}}" }}'
          pod_name: '{{ "{{\" }} pod_name {{ \"}}" }}'
          file: '{{ "{{\" }} file {{ \"}}" }}'
          cluster: '{{ "{{\" }} cluster {{ \"}}" }}'
          datacenter: '{{ "{{\" }} datacenter {{ \"}}" }}'
          rack: '{{ "{{\" }} rack {{ \"}}" }}'
          container_name: '{{ "{{\" }} container_name {{ \"}}" }}'
        encoding:
          codec: json

agent:
  enabled: true
Examine logs
Open the logs in the browser window where you forwarded the services.
Mission Control collects logs that running containers produce and static log file locations and makes them available in a common location within the UI. For a cluster of up to 500 nodes and 90 days of stored logs, query responses should return within 100 ms for a query spanning the previous hour with a pod name label or value.
To examine logs in the Mission Control UI:
-
In the Home Clusters dialog, click the target cluster namespace.
-
Click the Observability tab.
-
Click the Logs tab.
-
Review log activity for your cluster.
-
Optional: To filter the results:
-
In the Search field, enter a specific node name.
-
In the Node field, select a specific node name.
-
In the Start or End fields, enter the dates for a specific time period.
-
-
Optional: Click the clipboard icon on the row of your target message to copy and locally view log details.
Types of logs
- gc
-
also known as garbage collection. Aids in memory management by listing deallocated programming objects no longer used.
- systemd
-
centralized logs of all Linux kernel and user processes system messages.
- debug
-
aids in diagnosing and fixing bugs and errors.
Query the system.log within the Mission Control UI view.
