Creating and editing performance graphs
Add and edit performance graphs on the Dashboard.
Graphs can be added containing multiple metrics provided the metrics use the same unit. For example, a graph can contain multiple metrics showing utilization as a percentage, like CPU and disk utilization. Other metrics such as write or read requests for a cluster or the operating system load for a node cannot be added to the utilization graph. Metrics can be added to a graph for a cluster or for one or more nodes.
There are also widgets that display information on Alerts, Cluster Health, and Storage Capacity.
Procedure
-
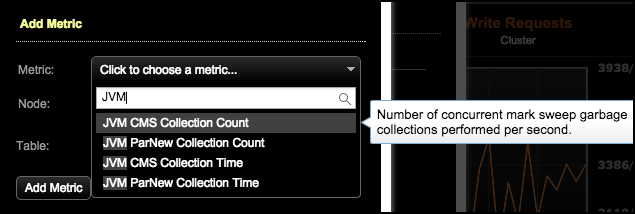
In the Add Metric dialog, select the metric you want to add from the
Metric list.
To search for a metric, begin typing the metric you want to search for and matching metrics populate in the list. To view its description, hover over a metric.
-
Select the nodes to monitor in the Node list. Select an
individual node, multiple nodes, all nodes within a data center, all nodes or
cluster wide as appropriate for the metric graph. To make multiple selections,
press and hold the Cmd key (Mac) or Ctrl key (Windows/Linux) to keep the list
open for multiple selections.

-
To add additional metrics that are measured using the same unit, click
Add Metric in the Metrics On This Graph dialog. To
edit the details of a metric, click the Edit icon. To
delete a metric, click the Trash icon.

-
To edit the metrics displayed in a graph, click the menu on the upper right
next to the graph title and click Edit Graph.
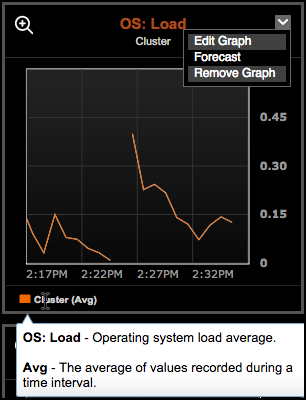
Hover over the metric in the graph legend to view its descriptions. -
To enable or disable the Alerts, Cluster Health, and Storage Capacity widgets,
click Add Widget and select the widget you want to enable
or disable.
