Example alert setup scenario for table metrics
Guidelines for configuring suggested alerts for tracking poor table performance.
Follow these guidelines to configure alerts for monitoring table performance. Any
triggered alerts appear in the Table Metrics Alerts panel within the Table Metrics
performance page. Some suggested basic alerts to enable and configure include:
- Any alerts on the Table (formerly Column Family) metrics shown in the charts
area of the Table Metrics performance page:
- TBL: Local Read Latency
- TBL: Local Write Latency
- TBL: Total Disk Used
- TBL: Cell Count
- TBL: Partition Size
- TBL: SSTables per Read
- TBL: SSTable Count
- Cluster-level metrics shown in the charts area of the Table Metrics
performance page:
- Write Request Latency - above 50 ms/op for more than one minute; also for more than 5 minutes
- Read Request Latency - above 50 ms/op for more than one minute; also for more than 5 minutes
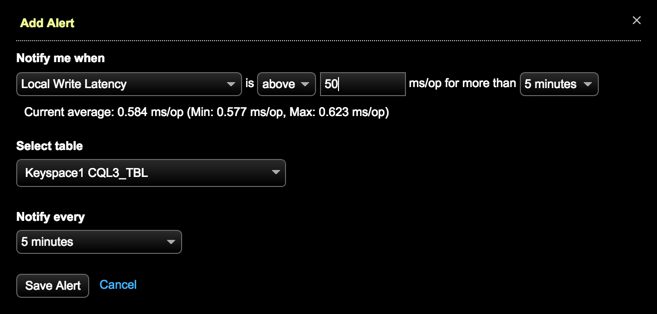
Table and local latency alerts are available from . Configure alerts of interest with thresholds appropriate for your environment.
Procedure
- Click the Alerts menu.
-
In the Active Alerts dialog, click Manage Alerts.
The Add Alert dialog appears.
- In the Notify me when menu, click .
-
Select the alert notification criteria:
- Select the table for local latency alerts.
- Select the nodes to monitor for cluster-level alerts.
-
Click Save Alert.
The alert displays in the Manage Alert Rules list. Repeat these steps for each additional alert.