Viewing repair status
View the status, progress, statistics, and complete details of the current Repair Service cycle in the Repair Status tab.
Access the Status Tab for the Repair Service
- Turn the Repair Service on. It immediately activates the Repair Service and opens the Status tab.
- If you are elsewhere in the monitoring application and the Repair Service is already activated, click Details for the Repair Service. The Repair Status tab displays full details for repair processes.
Monitor repair status
- When the Repair Service is actively processing repairs, the Repair Service Status indicates Active. The progress graphics and statistics reflect real-time measurements of repairs.
- The Repair Service Status appears Paused in response to cluster or schema change events.
The repair process performs validation compaction and streams data to and from other nodes in the cluster when synchronizing replicas. Those activities when active are visible in their respective panes.
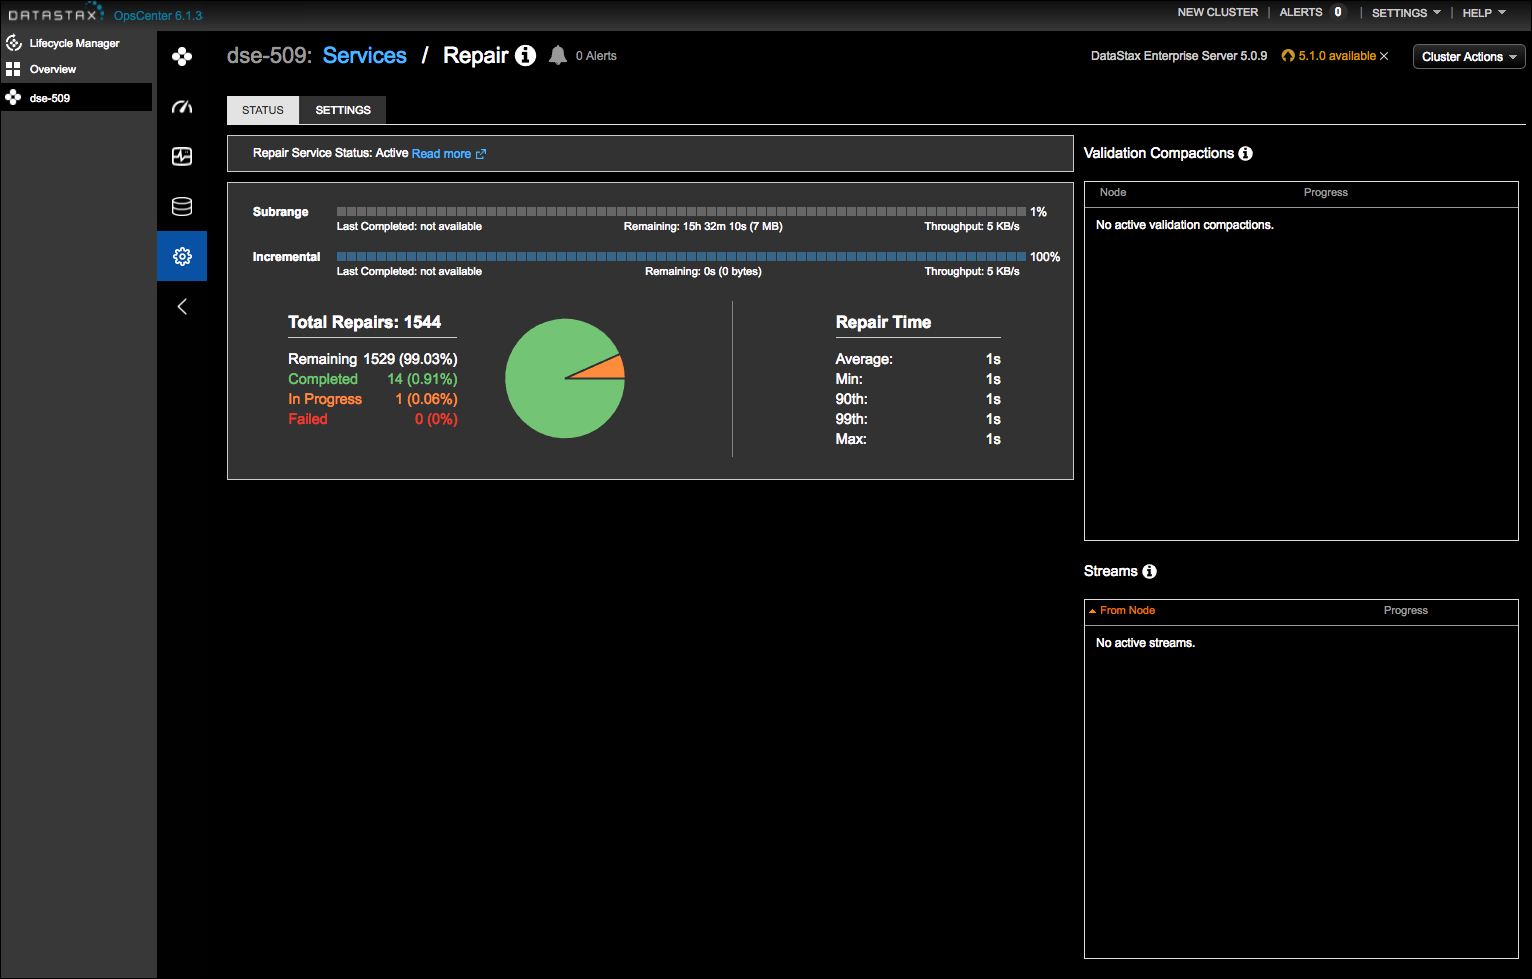
Status pane
Indicates whether the Repair Service Status is Active or Paused.
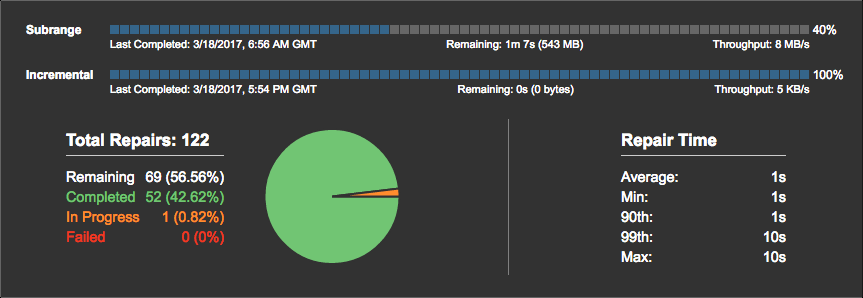
View repair progress and statistics
The progress and statistics pane displays progress bars for subrange and incremental repairs. A pie chart represents Completed, In Progress, and Failed repair tasks thus far. Remaining tasks are not represented in the pie chart; they are represented in the progress bars. The remaining time until the incremental and subrange repairs are completed is indicated underneath each respective progress bar.
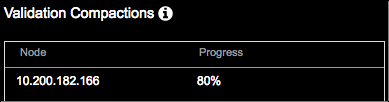
View validation compactions
A validation compaction reads and generates a hash for every row in the stored tables, adds the result to a Merkle tree, and returns the tree to the initiating node as part of the underlying Merkle tree comparison process.
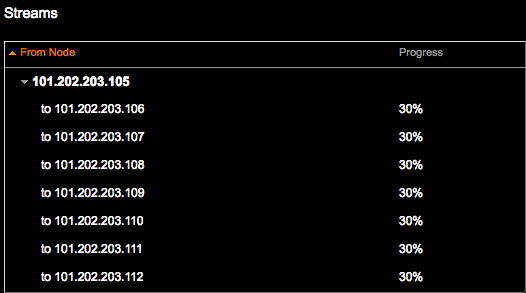
View streaming activity
The Streams pane displays an aggregate of streaming activity progress per node. The streams could be comprised of hundreds of files. When actively streaming data, the nodes from which the streams originate and their target node are shown along with progress bars for each node receiving streamed replica data. Otherwise, the No active streams status is displayed.