Working with metrics performance graphs
Add, edit, or remove performance metrics graphs on the OpsCenter Monitoring Dashboard. After an upgrade, edit or remove any graphs that contain unknown obsolete metrics.
Add, edit, or remove performance metrics graphs on the OpsCenter Monitoring Dashboard. After an upgrade, adjust or remove graphs that contain unknown obsolete metrics.
Graphs can be added containing multiple metrics provided the metrics use the same unit. For example, a graph can contain multiple metrics showing utilization as a percentage, like CPU and disk utilization. Other metrics such as write or read requests for a cluster or the operating system load for a node cannot be added to the utilization percentage graph. Metrics can be added to a graph for a cluster or for one or more nodes.
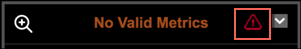
Remove the obsolete graph, or remove any obsolete metrics from dashboard graphs by deleting the unknown metric in the Metrics On This Graph dialog.
Procedure
-
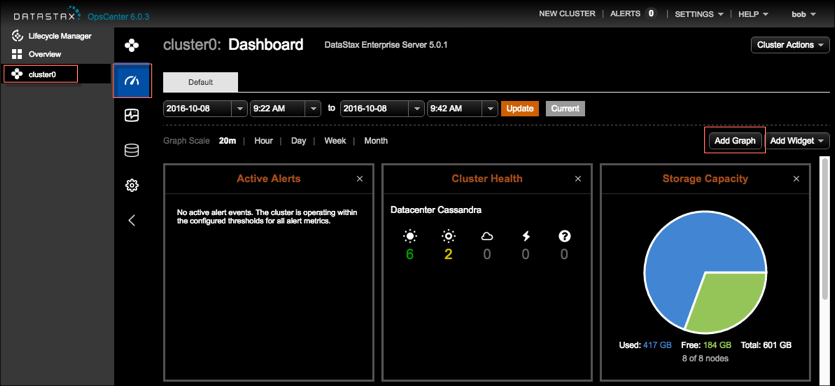
Click from the left navigation panes.
-
Click Add Graph.
The Add Metric dialog appears.
-
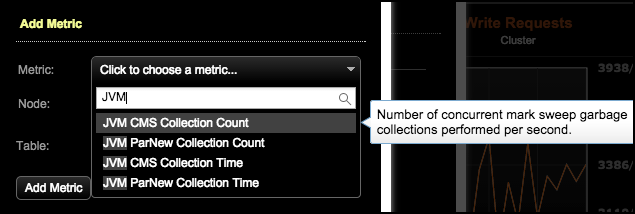
Select the metric to add from the Metric list.
Tip: To search for a metric, begin typing the metric you want to search for and matching metrics populate in the list. To view its description, hover over a metric. To make multiple selections, press and hold the Cmd key (Mac) or Ctrl key (Windows/Linux) to keep the list open for multiple selections.
-
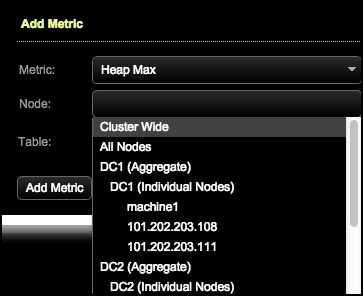
Select the nodes to monitor in the Node list. Select an
individual node, multiple nodes, all nodes within a datacenter, all nodes, or
cluster-wide as appropriate.
- Optional: To specify particular tables, click Table.
-
Click Add Metric.
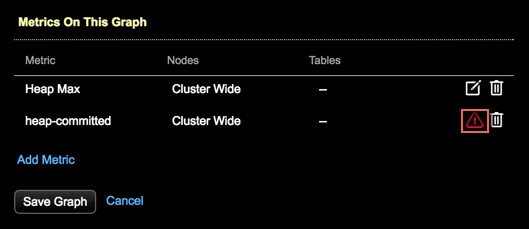
The Metrics on this graph dialog appears.
-
Make any changes to the graph metrics:
- To add additional metrics that are measured using the same unit, click the Add Metric link.
- To edit metric details such as the applicable nodes or tables, click the Edit icon.
- To delete a metric, click the Trash icon.
- When you are done, click Save Graph to display the graph showing the defined metrics.
-
To edit the metrics displayed in a graph, click the menu on the upper right
next to the graph title and click Edit Graph.
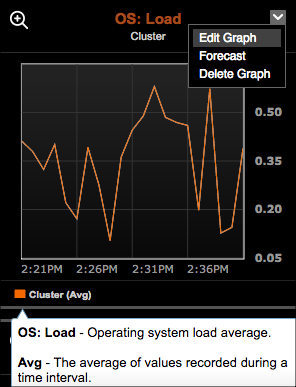
Hover over the metric in the graph legend to view its descriptions. - To delete a graph, click Delete Graph from the graph menu.
-
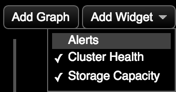
There are also widgets that display information on Alerts, Cluster Health, and
Storage Capacity. To enable or disable the Alerts, Cluster Health, or Storage
Capacity widgets, click Add Widget and select the widget
you want to enable or disable.