List View
List View is an alternative to the graphical Ring View. List View provides faster access to data and more flexibility when viewing data. All data is updated in real time.
List View is an alternative to the graphical Ring View. List View provides faster access to data and more flexibility when viewing data. All data is updated in real time.
To access the List view, click tab.
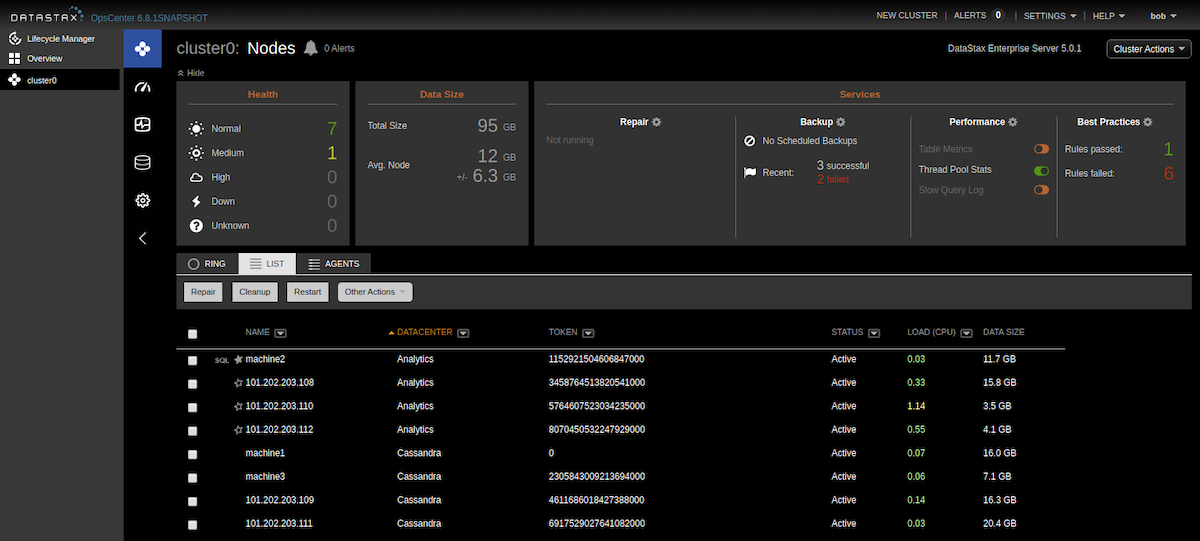
Select a check box next to the node or nodes to perform an operation on. Select the box next to the Name label to quickly select all nodes. Frequently performed actions such as repair and startup are available from the List View menu. The Other Actions menu provides options for less frequently performed actions, such as moving nodes. For more information, see Node management operations.
Icon legend
- Spark Masters are indicated with a solid star icon. The Node Details dialog also indicates the Spark Master in the Type area.
- Spark Workers are indicated with a star outline icon. The Node Details dialog also indicates the Spark Workers in the Type area.
- Solr search nodes are indicated with the magnify glass icon. The Node Details dialog also indicates Search with Graph-enabled nodes in the Type area.
- Always On SQL Service (AOSS) nodes are indicated with the
SQLicon. - Graph nodes are not indicated.
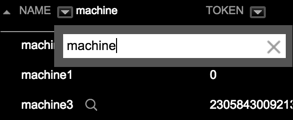
Filtering nodes
- Name: Enter the full or partial machine name or IP address in
the text box. The list is filtered by the criteria, and the filter criteria appears next
to the column label.
- Datacenter: Filter by datacenter node type category of All, Analytics, Cassandra, or Solr.
- Status: Filter by the node status of All, Active, or Unresponsive. The Status column displays whether a node is up or down, restarting, in a special mode (such as joining, draining, or moving), or running any tasks such as compactions.
- Load (CPU): Filter by All; Low, High, Medium CPU load; or Offline.
Sorting columns
Click a column label to sort columns in ascending or descending order. View which nodes have the most data, the highest CPU load, and so forth.
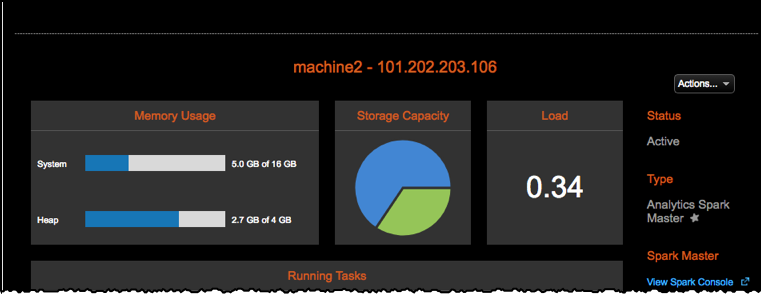
Viewing node details
Clicking the row for a node in the nodes list reveals the node details dialog that displays more information. Use the Actions menu to run various operations on the node.
View node details such as Status, Capacity, Uptime, and Memory Usage, including In Memory if in use.