Viewing repair status
View the status, progress, statistics, and complete details of the current Repair Service cycle in the Repair Status tab.
Access the Status Tab for the Repair Service
- Turn the Repair Service on. It immediately activates the Repair Service and opens the Status tab.
- If you are elsewhere in the monitoring application and the Repair Service is already activated, click Details for the Repair Service. The Repair Status tab displays full details for repair processes.
Monitor repair status
- When the Repair Service is actively processing repairs, the Repair Service Status indicates Active. The progress graphics and statistics reflect real-time measurements of repairs.
- The Repair Service Status appears Paused in response to cluster or schema change events.
The repair process performs validation compaction and streams data to and from other nodes in the cluster when synchronizing replicas. Those activities when active are visible in their respective panes.

Status pane
Indicates whether the Repair Service Status is Active or Paused.
View repair progress and statistics
The progress and statistics pane displays progress bars for subrange and incremental repairs. A pie chart represents Completed, In Progress, and Failed repair tasks thus far. Remaining tasks are not represented in the pie chart; they are represented in the progress bars. The remaining time until the incremental and subrange repairs are completed is indicated underneath each respective progress bar.

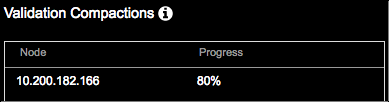
View validation compactions
A validation compaction reads and generates a hash for every row in the stored tables, adds the result to a Merkle tree, and returns the tree to the initiating node as part of the underlying Merkle tree comparison process.
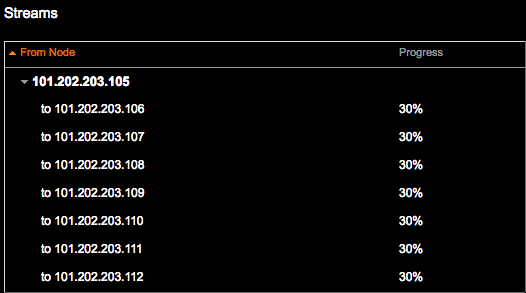
View streaming activity
The Streams pane displays an aggregate of streaming activity progress per node. The streams could be comprised of hundreds of files. When actively streaming data, the nodes from which the streams originate and their target node are shown along with progress bars for each node receiving streamed replica data. Otherwise, the No active streams status is displayed.
View repair tasks per table
- View keyspaces and tables excluded from repairs, grouped by the exclusion criteria.
- View details of repair tasks at the individual table level. Click a row to view repair task details isolated per keyspace table in the Repair Tasks for keyspace.table dialog.
Each column is sortable. Click a column heading to sort its column contents. The Status column provides visual status indicators along with a summary of completed, running, or pending repair tasks. Any task with errors displays a red explanation point.

The Total Attempts column indicates how many attempts (retries) the repair service has made before temporarily skipping the task. The skipped task is added to the end of the queue to retry later. The default maximum is 10 attempts. When that maximum is reached, an alert is fired and the Repair Service abandons any further repair attempts for that task. In the above graphic, 0/10 indicates all repair tasks completed without the need for any retry attempts. Configure the maximum attempts with the single_task_err_threshold option.
Incremental repair tables are opted in for repair as mentioned in the incremental repairs overview. There are a few OpsCenter
keyspace tables that are hard-coded for incremental repairs:
OpsCenter.backup_reports and OpsCenter.settings tables.
The incremental tooltip flags these as special tables and provides a link to documentation
to configure additional tables or datacenters to
include in incremental repairs. Any tables configured by OpsCenter admins appear in the
tasks pane sans the tooltip.
Incremental repairs have their own threshold setting for alerting about failed repair tasks. The default is 20. Configure with the incremental_err_alert_threshold option.
Observe the progress of incremental repairs using the SSTable repaired metrics available in the dashboard graphs. See Tracking repaired SSTables for incremental repairs.
View keyspaces and tables excluded from repairs
Excluding keyspaces and tables from unnecessary repairs makes repair processes more focused, efficient, and faster with less workload impact on DSE clusters.
A link is available above the Table Repair Tasks pane for viewing keyspaces and tables excluded from subrange repairs. Click the View excluded tables link. The Excluded Keyspaces and Tables dialog displays the keyspaces excluded due to RF=1, system keyspaces, reserved tables, or those specifically configured for subrange repairs to ignore.
dse_security and
system_auth keyspaces so that those keyspaces are included in repairs.
See Managing keyspaces and tables.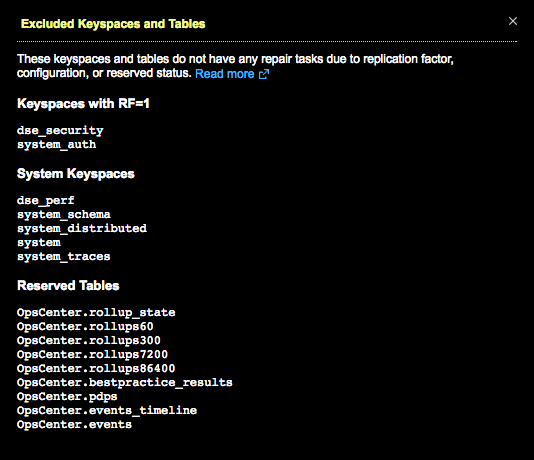
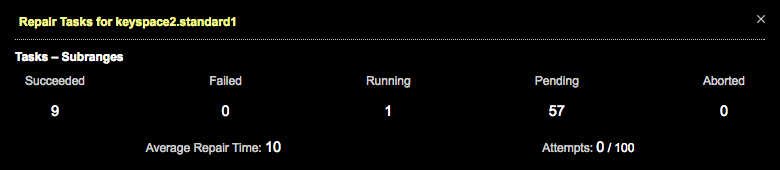
View details for repair tasks
Click any row of the Table Repair Tasks pane to view more details about a particular task.
The Repair Tasks for keyspace.table dialog provides details for the number of Succeeded, Failed, Running, Pending, and Aborted repair tasks for each repair-eligible table in a keyspace. The Average Repair Time and number of Attempts (configurable) for the repair task are also shown.