Add graphs to the OpsCenter Monitoring Dashboard to monitor latency between
datacenters and nodes.
Add graphs to the OpsCenter Monitoring Dashboard to monitor latency between
datacenters and nodes. Messaging latency metrics are available for DSE versions
5.1.0 and later.
Procedure
-
Click .
-
Click Add Graph.
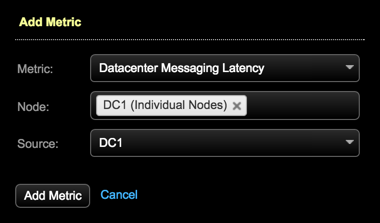
The Add Metric dialog appears.
-
Complete the dialog for each metric graph:
-
Choose Datacenter Messaging Latency from the
Metric list.
-
Choose the nodes to monitor from the Node list.
Available options:
- Cluster-wide
- All nodes
- Datacenter (aggregate)
- Datacenter (individual nodes)
- A single specific node
Note: If multiple selections are made in the Node list, reported
latencies are aggregated for all selections.
-
Select the datacenter from the Source
list.
-
Click Add Metric.
-
Repeat the procedure for the Node Message
Latency metric. Selecting a source datacenter is not
applicable to node-level graphs.
-
Add as many variations of these metrics as required for your
environment. When finished, click Save
Graph.
The graphs appear in the dashboard.


