Configuring tiered storage metric graphs
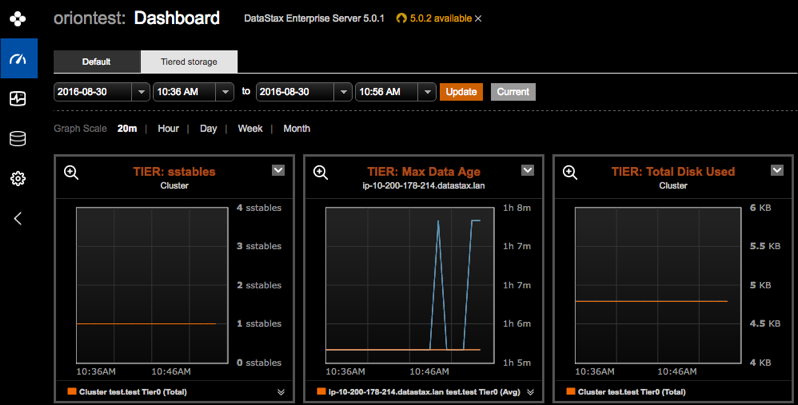
Configure tiered storage graphs to visually monitor data distribution and performance metrics for storage tiers.
Configure tiered storage graphs to visually monitor data distribution and performance
metrics for storage tiers. Add graphs for the following metrics:
Prerequisites
- For centralized configuration convenience, configure the strategy and tiers in Lifecycle Manager and run a configuration job to push the configuration to all applicable nodes.
- Apply tiered storage to a table schema and define the maximum age of data in
each
tier:
See DSE Tiered Storage for complete details.CREATE TABLE ks.tbl (k INT, c INT, v INT, PRIMARY KEY (k, c)) WITH COMPACTION={'class':'TieredCompactionStrategy', 'tiering_strategy': 'DateTieredStorageStrategy', 'config': 'strategy1', 'max_tier_ages': '3600,7200'};
Procedure
- Click .
- Optional:
Clone the
Default preset tab and give it a name such as
Tiered storage.

-
Click Add Graph.
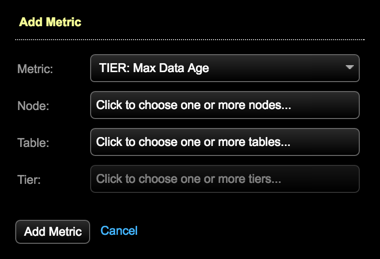
The Add Metric dialog appears.

-
Complete the dialog for each metric graph:

