Tracking repaired SSTables for incremental repairs
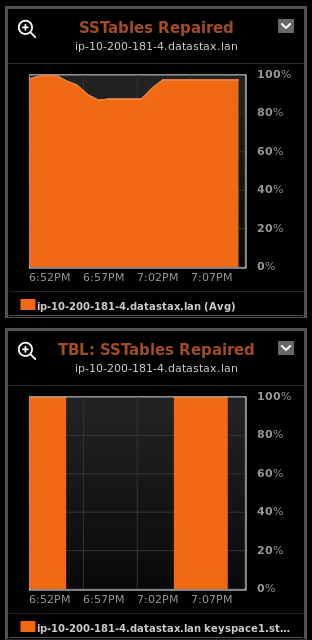
Add the SSTables Repaired metrics as dashboard graphs to track progress of incremental repairs (DSE 5.1 only).
Configure dashboard graphs to visually monitor the progress of repaired SSTables at the node and table levels during an incremental repair. The Repair Service uses the SSTables Repaired metrics to determine whether it should run incremental repairs, based on the configured value of the incremental_threshold option.
Add graphs for the following metrics:
- Percent Data Repaired [percentage-repaired]
- Percentage of data (uncompressed) marked as repaired across all non-system tables on a node. Tables with a replication factor of 1 are excluded.
- TBL: Percent Data Repaired [cf-percentage-repaired]
- Percentage of data (uncompressed) marked as repired for a given table on a node. This metric is only meaningful for replication factor > 1.
Note: The SSTables Repaired metrics are only meaningful for keyspaces that have a
replication factor of 2 or greater. The percentage repaired for a keyspace that has
an RF=1 displays percentage repaired as 0%.
Prerequisites
Procedure
- Click .
- Optional: Clone the Default preset tab and give it a name such as Repairs.
-
Click Add Graph.
The Add Metric dialog appears.
-
Choose the SSTables Repaired metric from the
Metric list.
Tip: Type SS to quickly locate the metric.
- Choose the nodes to monitor from the Node list.
-
Click Add Metric.
The metric is added to the dashboard.
- Repeat 3 through 6 for the TBL: SSTables Repaired metric and select the tables to monitor from the Tables list.
-
Repeat this procedure for all DSE 5.1 clusters that you need to monitor for
incremental repairs.

