Graph metrics
Metrics for monitoring DSE Graph with dashboard graphs and alerts in OpsCenter.
- Cache metrics: Cache metrics bound to a specific DSE graph. Per node per graph instance metrics.
- Request Latencies: Histogram of request latencies.
- Threadpool metrics: Global-level threadpool metrics for tasks that have active, pending, and completed threads.
Graph cache metrics
- Graph: Adjacency Cache Hits [graph-adjacency-cache-hit]
- Number of hits against the adjacency cache for this graph.
- Graph: Adjacency Cache Misses [graph-adjacency-cache-miss]
- Number of misses against the adjacency cache for this graph.
- Graph: Index Cache Hits [graph-index-cache-hit]
- Number of hits against the index cache for this graph.
- Graph: Index Cache Misses [graph-index-cache-miss]
- Number of misses against the index cache for this graph.
Graph transaction latencies
- Graph: Request Latencies [graph-request-latencies]
- The min, median, max, 90th, and 99th percentile of request latencies during the period.
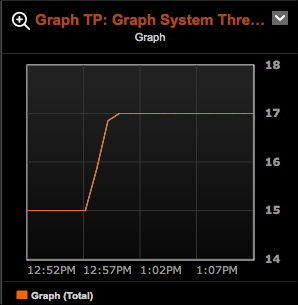
Graph threadpool metrics
Graph query threads, Graph scheduled threads, Graph system threads, and Graph Gremlin worker metrics for pending, active, and completed threads in the respective threadpools. Threadpool metrics are global across all graphs.
- Graph TP: Graph Scheduled Threads Pending [pending-graph-scheduled-threads]
- Number of pending tasks in the GraphScheduledThreads thread pool.
- Graph TP: Graph Scheduled Threads Active [active-graph-scheduled-threads]
- Number of active tasks in the GraphScheduledThreads thread pool.
- Graph TP: Graph Scheduled Threads Completed [completed-graph-scheduled-threads]
- Number of tasks completed by the GraphScheduledThreads thread pool.
- Graph TP: Graph System Threads Pending [pending-graph-system-threads]
- Number of pending tasks in the GraphSystemThreads thread pool.
- Graph TP: Graph System Threads Active [active-graph-system-threads]
- Number of active tasks in the GraphSystemThreads thread pool.
- Graph TP: Graph System Threads Completed [completed-graph-system-threads]
- Number of tasks completed by the GraphSystemThreads thread pool.
- Graph TP: Gremlin Worker Threads Pending [pending-gremlin-worker-threads]
- Number of pending tasks in the GremlinWorkerThreads thread pool.
- Graph TP: Gremlin Worker Threads Active [active-gremlin-worker-threads]
- Number of active tasks in the GremlinWorkerThreads thread pool.
- Graph TP: Gremlin Worker Threads Completed [completed-gremlin-worker-threads]
- Number of tasks completed by the GremlinWorkerThreads thread pool.
Dashboard Graphs for Graph Metrics
Dashboard graphs are available for all Graph metrics in OpsCenter. Click . Select the metric from the Metric list in the Add Metric dialog:
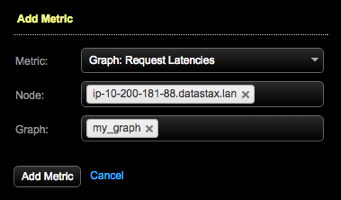
The Graph list is only applicable to the per graph cache metrics.
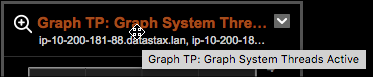
For longer graph titles that are truncated in the dashboard, hover over the graph title to view it in its entirety:
Graph Alerts
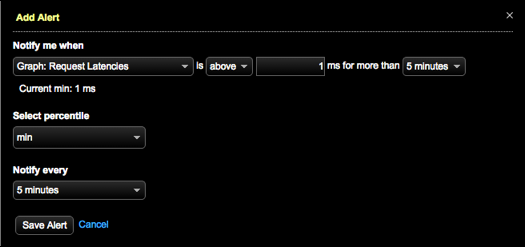
Alerts are available for all graph metrics. Click in the Add Alert dialog.
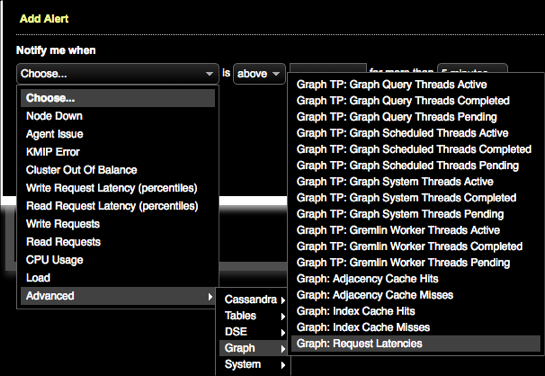
Define the notification criteria for each alert required for monitoring your DSE Graph environment.