Monitoring in-memory usage
Monitor in-memory usage from within OpsCenter.
Monitor in-memory usage from within OpsCenter. More information about Creating or altering tables to use DSE In-Memory is available in DSE In-Memory.
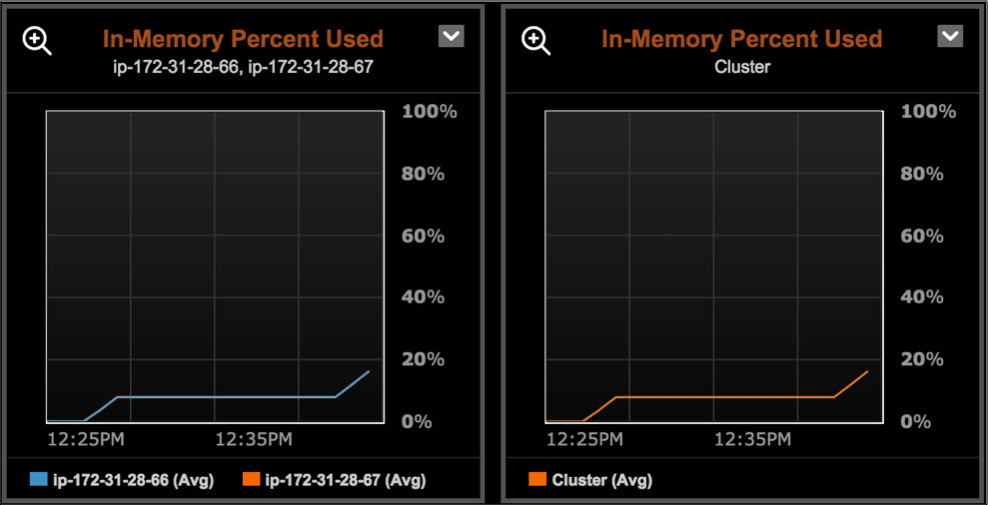
A metric and an alert are available for monitoring in-memory usage:
- The In-Memory Percent Used alert is available to configure for DataStax Enterprise nodes. If the in-memory usage exceeds the configured threshold, an alert is fired. Investigate the alert and adjust the memory threshold configuration as appropriate.
- The In-Memory Percent Used metric is available to
add as a separate
graph in the OpsCenter dashboard.
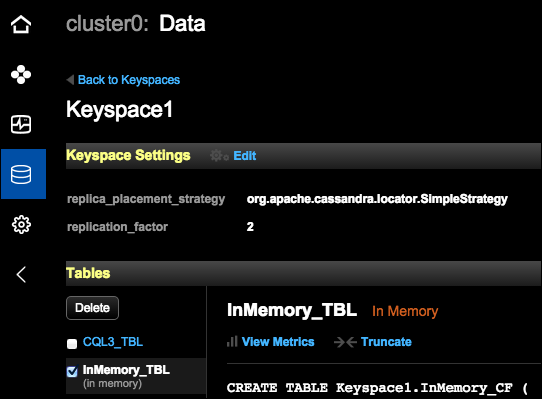
A visual cue (an In-Memory label next to the table name) in the Keyspaces area of OpsCenter indicates whether a table uses the In-Memory option. Click :
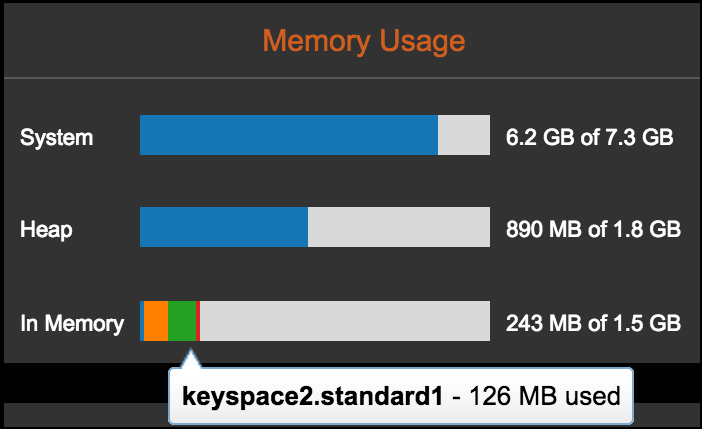
To view the in-memory usage of a node:
Procedure
- In the left navigation pane, click .
-
Click the node to view its details.
The details for the node are displayed. The Memory Usage bar graphs indicate System, Heap, and In-Memory Usage. The In-Memory Usage bar graph only appears if the In-Memory option is configured. The In-Memory Usage currently shown reflects all tables. Each in-memory table takes up a portion of the usage and displays as a different slice within the in-memory bar graph, up to the maximum threshold. The remainder of the graph represents free space.