Performance Service Overview
The OpsCenter Performance Service provides visual monitoring of diagnostics collected through the DSE Performance Service, displays alerts, and provides recommendations for optimizing cluster performance.
The OpsCenter Performance Service provides visual monitoring of diagnostics collected through the DSE Performance Service, displays alerts, and provides recommendations for optimizing cluster performance. The OpsCenter Performance Service combines OpsCenter metrics with CQL-based diagnostic tables populated by the DSE Performance Service to help understand, tune, and optimize cluster performance.
Performance Service overview panels
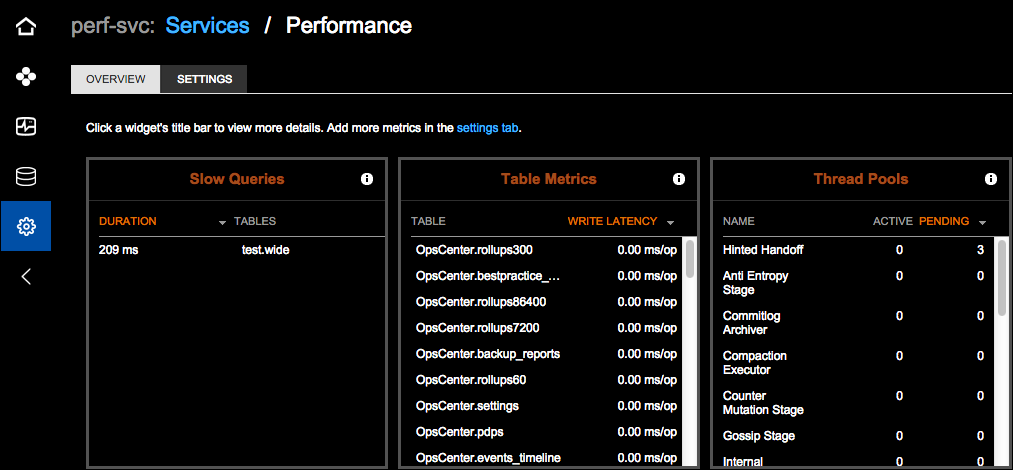
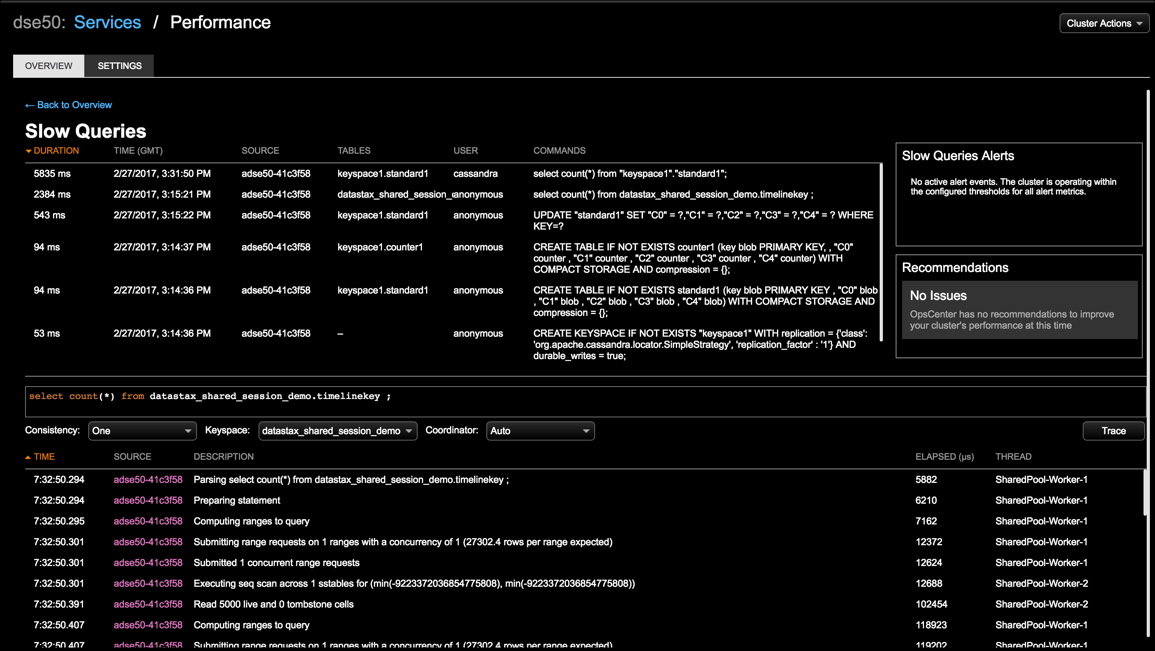
- Slow Queries: Identify slow queries on a cluster to easily find and tune poorly performing queries.
- Table Metrics: Displays metrics to discover and diagnose poorly performing tables.
- Thread Pool Statistics: Displays information about Cassandra system-level details such as thread pools.

Each panel contains a read-only high-level summary with pertinent sortable columns. Clicking on the title bar of a panel opens its expanded performance page:

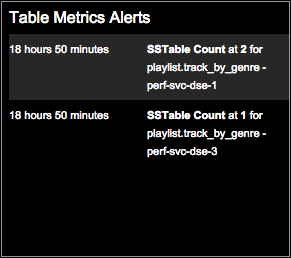
Alerts panel

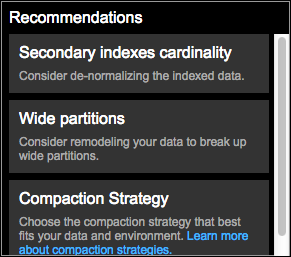
Recommendations panel
On each performance page in OpsCenter, a panel provides recommendations to rectify and improve performance issues.

Best Practice Service - Performance Service Advisors
- Performance Service - Slow Queries Advisor
- Performance Service - Table Stats Advisor
- Performance Service - Thread Pools Advisor

By default, all rules are enabled and scheduled to run every hour. Adjust the rule configuration to suit the requirements of your environment.
