Diagnostic tarball reference
Reference information about the contents of the diagnostic tarball.
opscenterd.log
The location of the opscenterd.log file depends on the type of installation:- Package installations: /var/log/opscenter/opscenterd.log
- Tarball installations: install_location/log/opscenterd.log
repair_service.log
All Repair Service activity is logged by default to a log file in therepair_service directory applicable to the
install type and each cluster name:- Package installations: /var/log/opscenter/repair_service/<cluster_name>.log
- Tarball installations: <install_location>/log/repair_service/<cluster_name>.log
cassandra-env.sh
The location of the cassandra-env.sh file depends on the type of installation:|
Package installations |
/etc/dse/cassandra/cassandra-env.sh |
|
Tarball installations |
installation_location/resources/cassandra/conf/cassandra-env.sh |
- The cassandra-env.sh file is located in the installation_location/conf directory.
opscenterd.conf
The location of the opscenterd.conf file depends on the type of installation:- Package installations: /etc/opscenter/opscenterd.conf
- Tarball installations: install_location/conf/opscenterd.conf
address.yaml
The location of the address.yaml file depends on the type of installation:- Package installations: /var/lib/datastax-agent/conf/address.yaml
- Tarball installations: install_location/conf/address.yaml
Reference information about the contents of the diagnostic tarball. Read the Diagnostic Tarball Goldmine article in the DataStax Support blogs for highlights and a useful summary of the OpsCenter diagnostic tarball files.
- nodes directory
- cluster_info.json file
- opscenterd directory
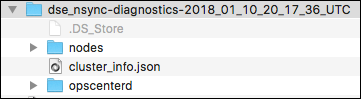
The directory structure after expanding the downloaded tarball:
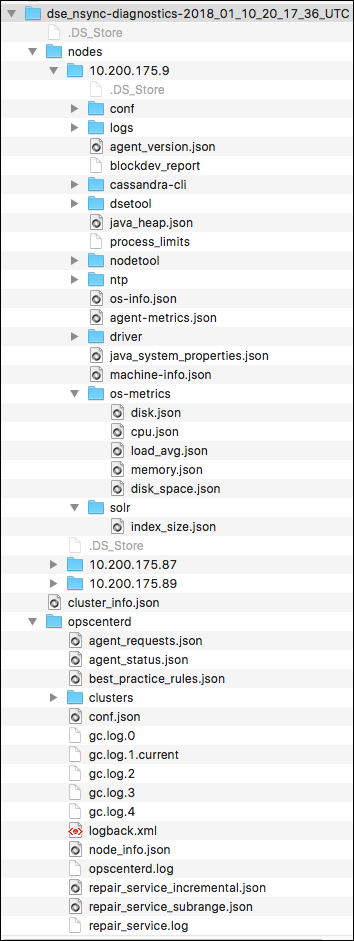
Diagnostic tarball files and directories
The directory structure, files, and their contents vary depending on the cluster and node configurations in an environment, and the installed versions of the DataStax Enterprise products.
- /conf/solr/, /logs/solr/, /logs/solr/tomcat/ for Solr nodes
- /conf/spark and /logs/spark for Spark nodes
Refer to the following table for links to more details about each file present in the diagnostic files directory. The sections below provide descriptions and examples.
| Main directories and files | Description | Files | Subdirectories |
|---|---|---|---|
| cluster_info.json file | Configuration and version information about the cluster. | See subdirectories. |
|
| node directory | Subdirectories named for each node in the cluster. |
|
|
| opscenterd directory | Log files, cluster configuration file, agent information, Best Practice Rules configuration, and status for the OpsCenter daemon. | clusters: contains the cluster_name.conf file for the cluster. For more details, see Cassandra connection properties. |
cluster_info.json
Contains configuration and version information about the cluster, such as: cassandra version, number of cores, cluster operating system, OpsCenter version and os, and so forth.
An example:
{
    "avg_token_count": 1,
    "bdp_version": [
        "6.0.0",
        null
    ],
    "cassandra_versions": [
        "4.0.0.1935",
        null
    ],
    "cluster_cores": 2,
    "cluster_instance_types": [
        "m3.large",
        null
    ],
    "cluster_os": [
        [
            "linux",
            "Ubuntu",
            "14.04",
            "amd64"
        ],
        [
            null,
            null,
            null,
            null
        ]
    ],
    "cluster_ram": 7985,
    "columnfamily_count": 11,
    "config_diff": {
        "cassandra": [
            "seed_hosts"
        ],
        "destinations": [
            "active"
        ],
        "webserver": [
            "interface"
        ]
    },
    "cql3_cf_count": 11,
    "dc_count": 1,
    "free_space": null,
    "is_enterprise": true,
    "keyspace_count": 6,
    "node_count": 3,
    "opscenter_arch": "",
    "opscenter_cores": null,
    "opscenter_instance_type": "m3.large",
    "opscenter_os": "linux",
    "opscenter_os_sub": "debian",
    "opscenter_os_version": "jessie/sid",
    "opscenter_ram": 7985,
    "opscenter_version": "6.5.0SNAPSHOT",
    "opscenterd_install_type": "package",
    "partitioner": "org.apache.cassandra.dht.Murmur3Partitioner",
    "python_version": "jython-2.7.1",
    "rack_map": {
        "Cassandra.rack1": 3
    },
    "separate_storage": false,
    "snitch": null,
    "strategy_options": [
        "{class=org.apache.cassandra.locator.SimpleStrategy, replication_factor=1}",
        "{class=org.apache.cassandra.locator.LocalStrategy}",
        "{class=org.apache.cassandra.locator.LocalStrategy}",
        "{class=org.apache.cassandra.locator.EverywhereStrategy}",
        "{class=org.apache.cassandra.locator.SimpleStrategy, replication_factor=1}",
        "{class=org.apache.cassandra.locator.EverywhereStrategy}",
        "{class=org.apache.cassandra.locator.SimpleStrategy, replication_factor=2}",
        "{class=org.apache.cassandra.locator.SimpleStrategy, replication_factor=3}",
        "{class=org.apache.cassandra.locator.LocalStrategy}",
        "{class=org.apache.cassandra.locator.SimpleStrategy, replication_factor=1}",
        "{class=org.apache.cassandra.locator.SimpleStrategy, replication_factor=3}",
        "{class=org.apache.cassandra.locator.SimpleStrategy, replication_factor=2}",
        "{class=org.apache.cassandra.locator.SimpleStrategy, replication_factor=1}"
    ],
    "used_space": null,
    "user": "anonymous"
}{
nodes diagnostic files
List of folders and files within each node folder.
agent_version.json file
Path: /nodes/node_folder_name/agent_version.json
The agent_version.json file indicates the version of the agent installed on a node.
6.1.2
agent-metrics.json file
Path: /nodes/node_folder_name/agent-metrics.json
Metrics collected from the node by the agent.
An excerpt:
{
  "cassandra" : {
    "histogram-size" : {
      "count" : 5825973,
      "description" : "Compressed size of histograms after serialization",
      "max" : 132,
      "mean" : 1.9609843069629802,
      "min" : 1,
      "p50" : 1.0,
      "p75" : 1.0,
      "p95" : 5.0,
      "p98" : 8.0,
      "p99" : 23.0,
      "p999" : 73.0,
      "stddev" : 6.083772288640086
    },
...
blockdev_report file
Path: /nodes/node_folder_name/blockdev_report
Contains a report on various statistics for block devices used by the operating system.
An example:
RO    RA   SSZ   BSZ   StartSec            Size   Device
rw   256   512  4096          0     34359738368   /dev/vda
rw   256   512  4096       2048     34358165504   /dev/vda1
cassandra-cli folder
Path: /nodes/node_folder_name/cassandra-cli
- describe_cluster
- show_keyspaces
The contents of both of these files state: The removal of Thrift in DSE 5.0
also removes support for cassandra-cli
conf folder
Path: /nodes/node_folder_name/conf
Configuration directory for all config files relevant to a node.
agent folder
stomp_interface: 10.200.181.112
use_ssl: 0# Based on the example properties given at http://logging.apache.org/log4j/1.2/manual.html
# Set root logger level to DEBUG and its only appender to A1.
log4j.rootLogger=INFO,R,stdout
log4j.logger.org.apache.http=OFF
log4j.logger.org.eclipse.jetty=WARN,stdout
log4j.logger.com.datastax.driver=WARN,R
log4j.additivity.com.datastax.driver=false
# Silence "missing LZ4" warning
log4j.logger.com.datastax.driver.core.FrameCompressor=ERROR,R
# stdout
log4j.appender.stdout=org.apache.log4j.ConsoleAppender
log4j.appender.stdout.layout=opsagent.AlternatingEnhancedPatternLayout
log4j.appender.stdout.layout.MainPattern=%5p [%t] %d{ISO8601} %m%n %throwable{200}
log4j.appender.stdout.layout.AlternatePattern=%5p [%t] %d{ISO8601} %m%n %throwable{3}
log4j.appender.stdout.layout.ToMatch=com.datastax.driver
# rolling log file
log4j.appender.R=org.apache.log4j.RollingFileAppender
log4j.appender.R.maxFileSize=20MB
log4j.appender.R.maxBackupIndex=5
log4j.appender.R.layout=opsagent.AlternatingEnhancedPatternLayout
log4j.appender.R.layout.MainPattern=%5p [%t] %d{ISO8601} %m%n %throwable{200}
log4j.appender.R.layout.AlternatePattern=%5p [%t] %d{ISO8601} %m%n %throwable{3}
log4j.appender.R.layout.ToMatch=com.datastax.driver
log4j.appender.R.File=/var/log/datastax-agent/agent.log
cassandra folder
Path: /nodes/node_folder_name/conf/cassandra
- cassandra-env.sh: Shell script file for the Cassandra environment used for adjusting JVM options, heap size, and setting JMX properties.
- cassandra.yaml: Configuration settings file for Cassandra.
- commitlog_archiving.properties: Properties file for commitlog archiving.
# Cassandra storage config YAML

# NOTE:
#   See http://wiki.apache.org/cassandra/StorageConfiguration for
#   full explanations of configuration directives
# /NOTE

# The name of the cluster. This is mainly used to prevent machines in
# one logical cluster from joining another.
cluster_name: sunshine

# This defines the number of tokens randomly assigned to this node on the ring
# The more tokens, relative to other nodes, the larger the proportion of data
# that this node will store. You probably want all nodes to have the same number
# of tokens assuming they have equal hardware capability.
#
# If you leave this unspecified, Cassandra will use the default of 1 token for legacy compatibility,
# and will use the initial_token as described below.
#
# Specifying initial_token will override this setting on the node's initial start,
# on subsequent starts, this setting will apply even if initial token is set.
#
# If you already have a cluster with 1 token per node, and wish to migrate to
# multiple tokens per node, see http://wiki.apache.org/cassandra/Operations
num_tokens: 1
...
# Licensed to the Apache Software Foundation (ASF) under one
# or more contributor license agreements.  See the NOTICE file
# distributed with this work for additional information
# regarding copyright ownership.  The ASF licenses this file
# to you under the Apache License, Version 2.0 (the
# "License"); you may not use this file except in compliance
# with the License.  You may obtain a copy of the License at
#
#   http://www.apache.org/licenses/LICENSE-2.0
#
# Unless required by applicable law or agreed to in writing,
# software distributed under the License is distributed on an
# "AS IS" BASIS, WITHOUT WARRANTIES OR CONDITIONS OF ANY
# KIND, either express or implied.  See the License for the
# specific language governing permissions and limitations
# under the License.

# commitlog archiving configuration.  Leave blank to disable.

# Command to execute to archive a commitlog segment
# Parameters: %path => Fully qualified path of the segment to archive
#             %name => Name of the commit log.
# Example: archive_command=/bin/ln %path /backup/%name
#
# commitlog archiving configuration.  Leave blank to disable.

# Command to execute to archive a commitlog segment
# Parameters: %path => Fully qualified path of the segment to archive
#             %name => Name of the commit log.
# Example: archive_command=/bin/cp -f %path /backup/%name
#
# Limitation: *_command= expects one command with arguments. STDOUT
# and STDIN or multiple commands cannot be executed.  You might want
# to script multiple commands and add a pointer here.
archive_command=

# Command to execute to make an archived commitlog live again.
# Parameters: %from is the full path to an archived commitlog segment (from restore_directories)
#             %to is the live commitlog directory
# Example: restore_command=/bin/cp -f %from %to
restore_command=

# Directory to scan the recovery files in.
restore_directories=
...# Licensed to the Apache Software Foundation (ASF) under one
# or more contributor license agreements. See the NOTICE file
# distributed with this work for additional information
# regarding copyright ownership. The ASF licenses this file
# to you under the Apache License, Version 2.0 (the
# "License"); you may not use this file except in compliance
# with the License. You may obtain a copy of the License at
#
# http://www.apache.org/licenses/LICENSE-2.0
#
# Unless required by applicable law or agreed to in writing, software
# distributed under the License is distributed on an "AS IS" BASIS,
# WITHOUT WARRANTIES OR CONDITIONS OF ANY KIND, either express or implied.
# See the License for the specific language governing permissions and
# limitations under the License.
calculate_heap_sizes()
{
case "`uname`" in
Linux)
system_memory_in_mb=`free -m | awk '/:/ {print $2;exit}'`
system_cpu_cores=`egrep -c 'processor([[:space:]]+):.*' /proc/cpuinfo`
;;
FreeBSD)
system_memory_in_bytes=`sysctl hw.physmem | awk '{print $2}'`
system_memory_in_mb=`expr $system_memory_in_bytes / 1024 / 1024`
system_cpu_cores=`sysctl hw.ncpu | awk '{print $2}'`
;;
SunOS)
system_memory_in_mb=`prtconf | awk '/Memory size:/ {print $3}'`
system_cpu_cores=`psrinfo | wc -l`
;;
Darwin)
system_memory_in_bytes=`sysctl hw.memsize | awk '{print $2}'`
system_memory_in_mb=`expr $system_memory_in_bytes / 1024 / 1024`
system_cpu_cores=`sysctl hw.ncpu | awk '{print $2}'`
;;
*)
# assume reasonable defaults for e.g. a modern desktop or
# cheap server
system_memory_in_mb="2048"
system_cpu_cores="2"
;;
esac
# some systems like the raspberry pi don't report cores, use at least 1
if [ "$system_cpu_cores" -lt "1" ]
then
system_cpu_cores="1"
fi
...dse folder
Path: /nodes/node_folder_name/conf/dse
- dse.yaml: Configuration settings file for DSE. See dse.yaml configuration file
- logback.xml: Configured logging files. See Configuring logging.
location.json file
This file indicates the location of the dse.yaml and cassandra.yaml files on the node. The location path is also indicative of the installation type.
{
  "dse" : "/etc/dse/dse.yaml",
  "cassandra" : "/etc/dse/cassandra/cassandra.yaml"
}
A tarball installation would indicate installation_location/resources/dse/conf/dse.yaml; and installation_location/resources/cassandra/conf/cassandra.yaml.
spark folder
Path: /nodes/node_folder_name/conf/spark
- dse-spark-env.sh
- hive-site.xml
- logback-spark.xml
- logback-spark-executor.xml
- logback-sparkR.xml
- logback-spark-server.xml
- spark-daemon-defaults.conf
- spark-defaults.conf
- spark-env.sh
solr folder
Path: /nodes/node_folder_name/solr
Contains the schema.xml and solrconfig.xml files for each category. See also the /node/solr/index_size.json file.
system folder hosts file
Path: /nodes/node_folder_name/conf/system/hosts
The system folder contains the hosts file derived from etc/hosts. The hosts file is an operating system plain text file that maps hostnames to IP addresses. The hosts file could be managed by a third party configuration management systems such as puppet.
driver folder
Path: /nodes/node_folder_name/driver
- metadata: Contains the cluster name and partitioner information.
- schema: Contains the schema with all CREATE statements.
dsetool folder
Path: /nodes/node_folder_name/dsetool
- ring: Lists the nodes in the ring.
- sparkmaster: Deprecated. Please use
dse
                            client-tool
instead.
/usr/bin/dsetool --host=127.0.0.1 --jmxport=7199 listjt
exit status: 1

stdout:
usage: dsetool [-short <arg>] [--long=<arg>] <command> [command-args]
 -a,--jmxusername <arg>           JMX user name
 -b,--jmxpassword <arg>           JMX password
 -c,--cassandra_port <arg>        Cassandra port to use
    --cipher-suites <arg>         Comma separated list of SSL cipher
                                  suites for connection to Cassandra when
                                  SSL is enabled
 -f,--config-file <arg>           DSE configuration file
java_heap.json file
Shows heap and non-heap memory usage. For more information, see tuning the Java heap.
{
  "HeapMemoryUsage" : {
    "committed" : 2092957696,
    "init" : 2092957696,
    "max" : 2092957696,
    "used" : 1234174816
  },
  "NonHeapMemoryUsage" : {
    "committed" : 128671744,
    "init" : 2555904,
    "max" : -1,
    "used" : 124666688
  }
}
java_system_properties.json file
Shows Java system properties.
Example excerpt:
{
  "java.rmi.server.hostname" : "10.200.181.112",
  "java.vendor.url.bug" : "http://bugreport.sun.com/bugreport/",
  "com.sun.management.jmxremote.authenticate" : "false",
  "cassandra.config.loader" : "com.datastax.bdp.config.DseConfigurationLoader",
  "java.vm.name" : "Java HotSpot(TM) 64-Bit Server VM",
  "java.vm.version" : "25.40-b25",
  "java.specification.name" : "Java Platform API Specification",
  "cassandra.custom_query_handler_class" : "com.datastax.bdp.cassandra.cql3.DseQueryHandler",
  "java.io.tmpdir" : "/tmp",
  "java.runtime.name" : "Java(TM) SE Runtime Environment",
  "sun.java.command" : "com.datastax.bdp.DseModule",
  "sun.java.launcher" : "SUN_STANDARD",
  "java.vendor" : "Oracle Corporation",
  "os.version" : "3.13.0-133-generic",
...
logs folder
Path: /nodes/node_folder_name/logs
- cassandra folder: Contains the debug.log, gremlin.log, output.log, and system.log files.
- opsagent folder: Contains the agent.log.
- solr folder: Contains the solrvalidation.log and the tomcat folder of its logs.
DEBUG [PerDiskMemtableFlushWriter_0:45] 2018-01-26 14:52:45,433  Memtable.java:485 - Completed flushing /var/lib/cassandra/data/system/local-7ad54392bcdd35a684174e047860b377/mc-55-big-Data.db (0.104KiB) for commitlog position CommitLogPosition(segmentId=1516899136469, position=31359084)
DEBUG [MemtableFlushWriter:45] 2018-01-26 14:52:45,438  ColumnFamilyStore.java:1228 - Flushed to [BigTableReader(path='/var/lib/cassandra/data/system/local-7ad54392bcdd35a684174e047860b377/mc-55-big-Data.db')] (1 sstables, 5.111KiB), biggest 5.111KiB, smallest 5.111KiB
DEBUG [COMMIT-LOG-ALLOCATOR] 2018-01-26 15:00:41,021  AbstractCommitLogSegmentManager.java:109 - No segments in reserve; creating a fresh one
DEBUG [MessagingService-Outgoing-/10.200.182.90-Small] 2018-01-26 15:12:14,113  OutboundTcpConnection.java:445 - Attempting to connect to /10.200.182.90
DEBUG [MessagingService-Outgoing-/10.200.182.90-Small] 2018-01-26 15:12:14,115  OutboundTcpConnection.java:552 - Done connecting to /10.200.182.90
DEBUG [RMI TCP Connection(1463)-127.0.0.1] 2018-01-26 15:12:14,116  StorageProxy.java:2642 - Schemas are in agreement.
...CompilerOracle: dontinline org/apache/cassandra/db/Columns$Serializer.deserializeLargeSubset (Lorg/apache/cassandra/io/util/DataInputPlus;Lorg/apache/cassandra/db/Columns;I)Lorg/apache/cassandra/db/Columns;
CompilerOracle: dontinline org/apache/cassandra/db/Columns$Serializer.serializeLargeSubset (Ljava/util/Collection;ILorg/apache/cassandra/db/Columns;ILorg/apache/cassandra/io/util/DataOutputPlus;)V
CompilerOracle: dontinline org/apache/cassandra/db/Columns$Serializer.serializeLargeSubsetSize (Ljava/util/Collection;ILorg/apache/cassandra/db/Columns;I)I
CompilerOracle: dontinline org/apache/cassandra/db/commitlog/AbstractCommitLogSegmentManager.advanceAllocatingFrom (Lorg/apache/cassandra/db/commitlog/CommitLogSegment;)V
......
INFO [main] 2018-01-25 16:47:18,498 YamlConfigurationLoader.java:89 - Configuration location: file:/etc/dse/cassandra/cassandra.yaml
INFO [main] 2018-01-25 16:47:18,603 DseConfig.java:402 - CQL slow log is enabled
INFO [main] 2018-01-25 16:47:18,604 DseConfig.java:403 - CQL system info tables are not enabled
INFO [main] 2018-01-25 16:47:18,604 DseConfig.java:404 - Resource level latency tracking is not enabled
INFO [main] 2018-01-25 16:47:18,605 DseConfig.java:405 - Database summary stats are not enabled
INFO [main] 2018-01-25 16:47:18,605 DseConfig.java:406 - Cluster summary stats are not enabled
INFO [main] 2018-01-25 16:47:18,605 DseConfig.java:407 - Histogram data tables are not enabled
INFO [main] 2018-01-25 16:47:18,606 DseConfig.java:408 - User level latency tracking is not enabled
INFO [main] 2018-01-25 16:47:18,606 DseConfig.java:410 - Spark cluster info tables are not enabled
INFO [main] 2018-01-25 16:47:18,606 DseConfig.java:444 - Cql solr query paging is: off
INFO [main] 2018-01-25 16:47:18,610 DseConfig.java:448 - This instance appears to have 1 thread per CPU core and 2 total CPU threads.
... INFO [qtp192788371-31108] 2017-07-28 23:00:00,022 HTTP request started:
{"protocol":"HTTP/1.1","remote-addr":"10.200.175.206","params":{},"headers":
{"user-agent":"http-kit/2.0","host":"10.200.175.206:61621","accept-encoding":
"gzip, deflate","content-length":"2","opscenter-id":"0f61c8368c834d3a9e4d9e8713e884bb",
"content-type":"application/json"},"server-port":61621,"content-length":2,"content-type":
"application/json","character-encoding":"UTF-8","uri":"/v1/bestpractice/check-wide-partitions",
"server-name":"10.200.175.206","query-string":"","scheme":"http","request-method":"get"}
...machine_info.json file
Shows the processor architecture and memory microcircuit of the CPU for a machine.
{
  "arch" : "amd64",
  "memory" : 7985
}
nodetool folder
Path: /nodes/node_folder_name/nodetool
The set of nodetool commands that OpsCenter executes is predetermined and controlled by the DataStax agent code. The nodetool operations do not depend on node workload or anything else such as nodetool commands that were executed externally from OpsCenter using the nodetool utility CLI. For more information, see the nodetool utility in the DSE Admin documentation.
- cfstats
- compactionhistory
- compactionstats
- describecluster
- getcompactionthroughput
- getstreamthroughput
- gossipinfo
- info
- netstats
- proxyhistograms
- ring
- status
- statusbinary
- tpstats
- version: Release Version of Cassandra, such as 4.0.0.1935.
Examples:
Current stream throughput: 200 Mb/s
Current streaming connections per host: 200/10.200.179.234
generation:1510023125
heartbeat:683548
STATUS:23:NORMAL,-9223372036854775808
LOAD:683492:5.80418858E8
SCHEMA:19:7af56410-33a6-38ed-980a-d07dbbafe831
DC:45:Cassandra
RACK:17:rack1
RELEASE_VERSION:4:4.0.0.1935
NATIVE_TRANSPORT_ADDRESS:3:10.200.179.234
X_11_PADDING:92140:{"dse_version":"6.0.0","workloads":"Cassandra","workload":"Cassandra","active":"true","server_id":"FA-16-3E-42-1E-22","graph":false,"health":0.9}
NET_VERSION:1:256
HOST_ID:2:9440f6c1-4d01-4216-ad9b-9d5c71afce6e
NATIVE_TRANSPORT_READY:58:true
NATIVE_TRANSPORT_PORT:5:9042
NATIVE_TRANSPORT_PORT_SSL:6:9042
STORAGE_PORT:7:7000
STORAGE_PORT_SSL:8:7001
JMX_PORT:9:7199
TOKENS:22:<hidden>
/10.200.179.235
generation:0
heartbeat:0
TOKENS: not present
/10.200.179.236
generation:1510023127
heartbeat:683533
STATUS:23:NORMAL,-3074457345618258603
LOAD:683481:5.87518118E8
SCHEMA:19:7af56410-33a6-38ed-980a-d07dbbafe831
DC:53:Cassandra
RACK:17:rack1
RELEASE_VERSION:4:4.0.0.1935
NATIVE_TRANSPORT_ADDRESS:3:10.200.179.236
X_11_PADDING:92067:{"dse_version":"6.0.0","workloads":"Cassandra","workload":"Cassandra","active":"true","server_id":"FA-16-3E-CA-BB-55","graph":false,"health":0.9}
NET_VERSION:1:256
HOST_ID:2:d71bb70d-4940-4eb2-addf-72897dd803f0
NATIVE_TRANSPORT_READY:65:true
NATIVE_TRANSPORT_PORT:5:9042
NATIVE_TRANSPORT_PORT_SSL:6:9042
STORAGE_PORT:7:7000
STORAGE_PORT_SSL:8:7001
JMX_PORT:9:7199
TOKENS:22:<hidden>ntp folder
Path: /nodes/node_folder_name/ntp
Contains files for NTP (Network Time Protocol) for clock synchronization. Synchronized clocks are critical for consistent data determined by timestamps. The diagnostic tarball runs nptstat and npttime.
- ntpstat: Reports the synchronisation state of the NTP daemon running on the local machine. Shows statistics for the NTP synchronization that indicates polling interval and time accuracy lifespan.
- ntptime: Monitors drift and offset from an NTP server. Shows some information about kernel parameters used by the NTP system.
synchronised to NTP server (10.200.175.206) at stratum 1
   time correct to within 24 ms
polling server every 60 sntp_gettime() returns code 0 (OK)
time dd33417a.f6cc3dd4 Mon, Aug 14 2017 19:44:55.964, (.964054877),
maximum error 106330 us, estimated error 100 us, TAI offset 0
ntp_adjtime() returns code 0 (OK)
modes 0x0 (),
offset 81.298 us, frequency -4.200 ppm, interval 1 s,
maximum error 106330 us, estimated error 100 us,
status 0x2001 (PLL,NANO),
time constant 6, precision 0.001 us, tolerance 500 ppm,os-info.json file
The operating system information file os-info.json shows the installed operating system and its version.
Example:
{
  "sub_os" : "CentOS Linux",
  "os_version" : "7.2.1511"
}
os-metrics folder
Path: /nodes/node_folder_name/os-metrics
- cpu.json
- disk_space.json
- disk.json
- load_avg.json
- memory.json
{
  "%user" : 2.5,
  "%nice" : 0.0,
  "%system" : 1.0,
  "%iowait" : 0.0,
  "%steal" : 0.0,
  "%idle" : 96.5
}{
"free" : {
"/dev/vda1" : 2.59
},
"used" : {
"/dev/vda1" : 27.51
},
"percentage" : {
"/dev/vda1" : 92
}
}{
"w/s" : {
"vda" : 0.0
},
"await" : {
"vda" : 0.0
},
"w_await" : {
"vda" : 0.0
},
"wMB/s" : {
"vda" : 0.0
},
"wrqm/s" : {
"vda" : 0.0
},
"rMB/s" : {
"vda" : 0.0
},
"r_await" : {
"vda" : 0.0
},
"%util" : {
"vda" : 0.0
},
"rrqm/s" : {
"vda" : 0.0
},
"r/s" : {
"vda" : 0.0
},
"svctm" : {
"vda" : 0.0
},
"avgrq-sz" : {
"vda" : 0.0
},
"avgqu-sz" : {
"vda" : 0.0
}
}0.29{
"used" : 4800,
"free" : 201,
"shared" : 0,
"buffers" : 69,
"cached" : 2913
}process limits file
Example:
clojure.lang.ExceptionInfo: throw+: {:type :opsagent.jmx/not-jmx-context, :message
 "[BUG] Tried to access JMX mbean outside of JMX context.", :details {:mbean
"java.lang:type=Runtime", :attributes [:Name]}} {:type :opsagent.jmx/not-jmx-context,
:message "[BUG] Tried to access JMX mbean outside of JMX context.",
:details {:mbean "java.lang:type=Runtime", :attributes [:Name]}}
solr folder index size json file
Path: /nodes/node_folder_name/solr/index_size.json
Contains the index_size.json file. If the node is not configured as a solr workload type, this file is empty.
See also the /solr folder in the /conf directory.
{
  "ax.account_freq_accessed" : 4523176,
  "ax.account" : 6106829,
  "ax.tn_activation_event" : 35541859,
  "ax.tn_by_partition" : 4282176,
  "ax.account_recent_accessed" : 274820,
  "cdr.call_details" : 19409157,
  "ax.account_history" : 2191447655,
  "ax.rate_center_by_prefix" : 36048878,
  "ax.management_user" : 153750
}
opscenterd folder of diagnostic files
This section of the diagnostic tarball directory contains files that provide information relevant to the OpsCenter daemon opscenterd.
Agent requests json file
Path: /opscenterd/agent_requests.json
The agent_requests.json file lists a success or failure status for the agent requests associated with each node.
{
    "10.200.175.206": "success",
    "10.200.175.207": "success"
}
Agent status json file
Path: /opscenterd/agent_status.json
The agent_status.json file lists status for the agent associated with each node. Similar information can be viewed in the Agent Status UI of OpsCenter. An excerpt:
{
    "10.200.175.206": {
        "agent_install_type": "package",
        "agent_status": {
            "condition": "ALL_OK",
            "http": {
                "status": "up",
                "updated_at": 1502135084
            },
            "install_status": {
                "error-message": null,
                "state": null
            },
            "jmx": {
                "status": "up",
                "updated_at": 1502135084
            },
...
Best practice rules json file
Path: /opscenterd/best_practice_rules.json
The best_practice_rules.json file lists status for the enabled Best Practice Rules. For more information, see Best Practice Service. An excerpt:
{
    "check-2i-cardinality": {
        "agents-are-compatible": true,
        "alert-level": "alert",
        "category": "Performance Service - Table Metrics",
        "description": "Checks for secondary indexes with too many distinct values.",
        "display-name": "Secondary indexes cardinality",
        "enabled_by_default": true,
        "errors": {
            "node-errors": [
                "10.200.175.206",
                "10.200.175.207"
            ]
        },
        "importance": "low",
        "name": "check-2i-cardinality",
        "recommendation": "Consider denormalizing the indexed data.",
        "run_time": "2017-08-08 19:00:37.640000",
        "scope": "cluster-and-node",
        "status": "Failed",
        "suggested_interval": "hourly",
        "version": "5.0.0"
    },
...
Clusters folder config files
Path: /opscenterd/clusters/cluster_name.conf
[destinations]
active =

[kerberos]
default_service =
opscenterd_client_principal =
opscenterd_keytab_location =
agent_keytab_location =
agent_client_principal =

[agents]
ssl_keystore_password =
ssl_keystore =
backup_staging_dir = /tmp

[jmx]
password =
port = 7199
username =
...Conf json file
Path: /opscenterd/conf.json
The conf.json file is a JSON representation of the config that
was passed into the in-memory representation of a cluster in
opscenterd. The contents represent
opscenterd.conf. An excerpt (note the
diagnostic_tarball_download_timeout):
{
    "agent_config": {},
    "agents": {
        "agent_aggregation_flush": "600",
        "agent_certfile": "/var/lib/opscenter/ssl/agentKeyStore.der",
        "agent_install_mute_period": "120",
        "agent_install_poll_period": "5",
        "agent_install_timeout_period": "1800",
        "agent_keyfile": "/var/lib/opscenter/ssl/agentKeyStore",
        "agent_keyfile_raw": "/var/lib/opscenter/ssl/agentKeyStore.key",
        "api_port": "61621",
        "backup_staging_dir": "/tmp",
        "call_agent_retry": "3",
        "concurrent_agent_requests": "10",
        "concurrent_settings_requests": "10",
        "concurrent_snapshot_list_requests": "1",
        "config_sleep": "420",
        "diagnostic_tarball_download_timeout": "120",
        "ec2_metadata_api_host": "169.254.169.254",
        "http_poll_period": "60",
        "http_timeout": "10",
        "incoming_interface": "0.0.0.0",
        "incoming_port": "61620",
        "not_seen_threshold": "180",
        "remote_backup_region": "us-west-1",
        "restore_req_update_period": "",
        "scp_executable": "/usr/bin/scp",
        "snapshot_wait": "60",
        "ssh_executable": "/usr/bin/ssh",
        "ssh_keygen_executable": "/usr/bin/ssh-keygen",
        "ssh_keyscan_executable": "/usr/bin/ssh-keyscan",
        "ssh_port": "22",
        "ssh_sys_known_hosts_file": "/etc/ssh/ssh_known_hosts",
        "ssh_user_known_hosts_file": "~/.ssh/known_hosts",
        "ssl_certfile": "/var/lib/opscenter/ssl/opscenter.der",
        "ssl_keyfile": "/var/lib/opscenter/ssl/opscenter.key",
        "ssl_keystore": "",
        "ssl_keystore_password": "",
        "storage_ssl_keystore": "",
        "storage_ssl_keystore_password": "",
        "tmp_dir": "/usr/share/opscenter/tmp/",
        "use_ssl": "False"
    },
    "authentication": {
        "authentication_method": "DatastaxEnterpriseAuth",
        "enabled": "False",
        "passwd_db": "/etc/opscenter/passwd.db",
        "password_hash_type": "bcrypt+blake2b-512",
        "sqlite_connection_timeout": "5",
        "sqlite_max_active_connections": "200",
        "sqlite_timeout": "10",
        "timeout": "0"
    },
    "backups": {
        "failure_threshold": "50",
        "restore_init_throttle": "20",
        "restore_sleep": "5"
    },
    "bestpractice": {
        "results_ttl": "2419200"
    },
   ...
gc logs
Path: /opscenterd/gc.log.n
The gc logs record garbage collection activity. Look at the logs marked as current first.
The number and max size of the GC log files are configurable via JVM command-line parameters. The default (used by the OpsCenter start/stop script) is to allow for no more than 5 log files, each with a maximum size of 1M. The gc logs are named gc.log.0, gc.log.1, gc.log.2, gc.log.3, and gc.log.4.
An excerpt:
2017-08-08 21:51:45 GC log file created /var/log/opscenter/gc.log.4
Java HotSpot(TM) 64-Bit Server VM (25.40-b25) for linux-amd64 JRE (1.8.0_40-b25), built on Feb 10 2015 21:29:53 by "java_re" with gcc 4.3.0 20080428 (Red Hat 4.3.0-8)
Memory: 4k page, physical 8176868k(185744k free), swap 0k(0k free)
CommandLine flags: -XX:CICompilerCount=2 -XX:+CMSParallelRemarkEnabled -XX:+CMSScavengeBeforeRemark -XX:GCLogFileSize=1048576 -XX:+HeapDumpOnOutOfMemoryError -XX:HeapDumpPath=/var/log/opscenter -XX:InitialHeapSize=1073741824 -XX:MaxHeapSize=1073741824 -XX:MaxNewSize=174456832 -XX:MaxTenuringThreshold=6 -XX:MinHeapDeltaBytes=196608 -XX:NewSize=174456832 -XX:NumberOfGCLogFiles=5 -XX:OldPLABSize=16 -XX:OldSize=899284992 -XX:+PrintGC -XX:+PrintGCApplicationStoppedTime -XX:+PrintGCCause -XX:+PrintGCDateStamps -XX:+PrintGCDetails -XX:+PrintGCTimeStamps -XX:+PrintTenuringDistribution -XX:+ScavengeBeforeFullGC -XX:+UseCompressedClassPointers -XX:+UseCompressedOops -XX:+UseConcMarkSweepGC -XX:+UseGCLogFileRotation -XX:+UseParNewGC
2017-08-08T21:51:45.139+0000: 2676054.673: [GC (Allocation Failure) 2676054.673: [ParNew
Desired survivor size 8716288 bytes, new threshold 6 (max 6)
- age   1:    7443576 bytes,    7443576 total
- age   2:      42208 bytes,    7485784 total
- age   3:      16712 bytes,    7502496 total
- age   4:      23256 bytes,    7525752 total
- age   5:       8992 bytes,    7534744 total
- age   6:      10160 bytes,    7544904 total
: 144097K->7656K(153344K), 0.0561916 secs] 356715K->220280K(1031552K), 0.0564842 secs] [Times: user=0.08 sys=0.00, real=0.06 secs]
2017-08-08T21:51:45.195+0000: 2676054.729: Total time for which application threads were stopped: 0.0685484 seconds, Stopping threads took: 0.0005691 seconds
2017-08-08T21:52:37.246+0000: 2676106.781: Total time for which application threads were stopped: 0.0012871 seconds, Stopping threads took: 0.0001447 seconds
2017-08-08T21:53:37.289+0000: 2676166.823: [GC (Allocation Failure) 2676166.823: [ParNew
logback
Path: /opscenterd/logback.xml
<?xml version="1.0" encoding="UTF-8"?>
<!--
Logback configuration file for OpsCenter.

Common options that you may want to change include:

    file - This is the name and location of the active log file that is currently
        being written to. This maps to the log_path property in previous versions
        of OpsCenter. If you change this property, you may want to also change
        fileNamePattern.

    fileNamePattern - This is the name, location and pattern of log files after they
        exceed the rolling policy. If you change this property, you may want to also
        change file.

    maxIndex - This is the number of rolled log files to keep. This maps to the max_rotate
        property in previous versions of OpsCenter. The default value is 10.

    maxFileSize - This is the file size that will cause the current log file to
        roll into an archived file. This maps to the log_length property in previous
        versions of OpsCenter. The default is '10MB'.

    level - This is the minimum logging level that will be included in the log
        files along with all higher logging levels. Valid values are TRACE, DEBUG,
        INFO, WARN and ERROR. Unlike previous versions of OpsCenter logging, each
        logger can have a different level associated with it. Changing the level
        property on the <root> element is equivalent to setting the level property
        in previous versions of OpsCenter.

Additional details on advanced configuration options can be found in the Logback
manual at  http://logback.qos.ch/manual/configuration.html.
-->
<configuration>
    <appender name="opscenterd_log" class="ch.qos.logback.core.rolling.RollingFileAppender">
      <file>/var/log/opscenter/opscenterd.log</file>
        <encoder>
            <charset>UTF-8</charset>
            <pattern>%date{ISO8601, UTC} [%X{cluster_id:-opscenterd}] %5level: %msg \(%thread\)%n%exception{20}</pattern>
        </encoder>
        <rollingPolicy class="ch.qos.logback.core.rolling.FixedWindowRollingPolicy">
          <fileNamePattern>/var/log/opscenter/opscenterd.%i.log</fileNamePattern>
          <minIndex>1</minIndex>
          <maxIndex>10</maxIndex>
        </rollingPolicy>
        <triggeringPolicy class="ch.qos.logback.core.rolling.SizeBasedTriggeringPolicy">
            <maxFileSize>10MB</maxFileSize>
        </triggeringPolicy>
    </appender>

    <appender name="STDOUT" class="ch.qos.logback.core.ConsoleAppender">
        <encoder>
            <charset>UTF-8</charset>
            <pattern>%date{ISO8601, UTC} [%X{cluster_id:-opscenterd}] %5level: %msg \(%thread\)%n%exception{20}</pattern>
        </encoder>
        <filter class="ch.qos.logback.classic.filter.ThresholdFilter">
            <level>INFO</level>
        </filter>
    </appender>

    <appender name="repair_log" class="ch.qos.logback.classic.sift.SiftingAppender">
      <discriminator>
          <key>cluster_id</key>
          <defaultValue>unknown</defaultValue>
      </discriminator>
      <sift>
        <appender name="repair_log_${cluster_id}" class="ch.qos.logback.core.rolling.RollingFileAppender">
          <file>/var/log/opscenter/repair_service/${cluster_id}.log</file>
            <encoder>
                <charset>UTF-8</charset>
                <pattern>%date{ISO8601, UTC} [%X{repair_type:-repair_service}] %5level: %msg \(%thread\)%n%exception{20}</pattern>
            </encoder>
            <rollingPolicy class="ch.qos.logback.core.rolling.FixedWindowRollingPolicy">
              <fileNamePattern>/var/log/opscenter/repair_service/${cluster_id}.%i.log</fileNamePattern>
              <minIndex>1</minIndex>
              <maxIndex>10</maxIndex>
            </rollingPolicy>
            <triggeringPolicy class="ch.qos.logback.core.rolling.SizeBasedTriggeringPolicy">
                <maxFileSize>10MB</maxFileSize>
            </triggeringPolicy>
            <filter class="ch.qos.logback.classic.filter.ThresholdFilter">
            	<level>INFO</level>
            </filter>
        </appender>
      </sift>
    </appender>

    <appender name="http_log" class="ch.qos.logback.core.rolling.RollingFileAppender">
      <file>/var/log/opscenter/http.log</file>
        <encoder>
            <charset>UTF-8</charset>
            <pattern>%date{ISO8601, UTC} [%X{cluster_id}] %5level: %msg \(%thread\)%n%exception{20}</pattern>
        </encoder>
        <rollingPolicy class="ch.qos.logback.core.rolling.FixedWindowRollingPolicy">
          <fileNamePattern>/var/log/opscenter/http.%i.log</fileNamePattern>
          <minIndex>1</minIndex>
          <maxIndex>10</maxIndex>
        </rollingPolicy>
        <triggeringPolicy class="ch.qos.logback.core.rolling.SizeBasedTriggeringPolicy">
            <maxFileSize>10MB</maxFileSize>
        </triggeringPolicy>
        <filter class="ch.qos.logback.classic.filter.ThresholdFilter">
            <level>INFO</level>
        </filter>
    </appender>

    <appender name="security" class="ch.qos.logback.core.ConsoleAppender">
        <encoder>
            <charset>UTF-8</charset>
            <pattern>%date{ISO8601, UTC} [%X{cluster_id}] %msg \(%thread\)%n%exception{20}</pattern>
        </encoder>
        <filter class="ch.qos.logback.classic.filter.ThresholdFilter">
            <level>INFO</level>
        </filter>
    </appender>

    <root level="INFO">
        <appender-ref ref="opscenterd_log"/>
        <appender-ref ref="STDOUT"/>
    </root>

    <logger name="com.datastax.driver" level="WARN" additivity="false"/>
    <logger name="com.datastax.driver.core.FrameCompressor" level="ERROR"/>
    <logger name="org.apache.mina" level="INFO" additivity="false" />
    <logger name="org.apache.directory" level="INFO" additivity="false"/>
    <logger name="org.python" level="ERROR"/>
    <logger name="org.jboss.netty" level="ERROR"/>
    <logger name="org.apache.http" level="ERROR"/>
    <logger name="com.mchange" level="ERROR"/>
    <logger name="io.netty.util.concurrent.DefaultPromise.rejectedExecution" level="DEBUG" />

    <!-- Repair Service logger -->
    <logger name="opscenterd.repair" additivity="false">
      <appender-ref ref="repair_log"/>
    </logger>

    <!-- HTTP Request logger -->
    <logger name="opscenterd.http" additivity="false">
      <appender-ref ref="http_log"/>
    </logger>

    <!-- Security Audit logger -->
    <logger name="opscenterd.security-audit" additivity="false">
      <appender-ref ref="security" />
    </logger>

</configuration>
Node information json file
Path: /opscenterd/node_info.json
- note IP
- agent JVM version
- graph enablement status
- keyspace sizes
- version information for Cassandra, DSE, Search, Spark
{
    "10.139.48.107": {
        "agent_jvm_version": "1.8.0_101",
        "alias": null,
        "data_held": 2113845533,
        "dc": "entcasprdtopdc1",
        "devices": {
            "commitlog": "dm_3",
            "data": [
                "dm_3"
            ],
            "other": [
                "dm_15",
                "dm_14",
                "dm_13",
                "dm_12",
                "dm_11",
                "dm_10",
                "dm_9",
                "dm_8",
                "dm_7",
                "dm_6",
                "dm_5",
                "dm_4",
                "dm_2",
                "dm_1",
                "dm_0",
                "sda",
                "sdc",
                "sdb"
            ],
            "saved_caches": "dm_3"
        },
        "ec2": {
            "ami-id": null,
            "instance-id": null,
            "instance-type": null,
            "placement": null
        },
        "graph_enabled": false,
        "hostname": "toplxcasp001.iss.bnr.com",
        "inmemory": {
            "max": 6594913894,
            "tables": [],
            "version": 2
        },
        "keyspace_sizes": {
            "OpsCenter": 16050165,
            "activetraininformation": 0,
            "activetrainschedule": 0,
            "dse_leases": 0,
            "dse_perf": 6281,
            "dse_security": 0,
            "dse_system": 0,
            "solr_admin": 15839,
            "system": 2097578223,
            "system_auth": 27296,
            "system_distributed": 25589,
            "system_schema": 131473,
            "system_traces": 0,
            "test": 10667
        },
        "last_seen": 0,
        "load": 0.61,
        "mode": "normal",
        "network_interfaces": [
            "usb0",
            "bond0",
            "eth0",
            "eth1",
            "eth2",
            "eth3",
            "lo"
        ],
        "node_ip": "10.139.48.107",
        "node_version": {
            "cassandra": "3.0.12.1586",
            "dse": "5.0.7",
            "search": "4.10.3",
            "spark": {
                "master": null,
                "version": null,
                "worker": null
            }
        },
        "num_procs": 16,
        "os": "linux",
        "partitions": {
            "commitlog": "/dev/dm_3",
            "data": [
                "/dev/dm_3"
            ],
            "other": [
                "/dev/dm_15",
                "/dev/dm_6",
                "/dev/dm_11",
                "/dev/dm_10",
                "/dev/dm_8",
                "/dev/dm_5",
                "/dev/dm_4",
                "/dev/dm_7",
                "/dev/dm_14",
                "/dev/dm_12",
                "/dev/dm_9",
                "/dev/dm_13",
                "/dev/dm_2",
                "/dev/sda1",
                "/dev/dm_1",
                "/dev/dm_0"
            ],
            "saved_caches": "/dev/dm_3"
        },
        "rack": "entcasprdtoprack1",
        "rpc_ip": "10.139.48.107",
        "streaming": {},
        "task_progress": {},
        "token": "-137630006671290277",
     ...
        "vnodes": true
    },
...
OpsCenter Daemon (opscenterd) log
Path: /opscenterd/opscenterd.log
The opscenterd.log file is the log for all processes running on the OpsCenter daemon (opscenterd). An excerpt:
...
2017-07-22 04:31:00,015 [sunshine]  INFO: Scheduled job 4d55b512-1e8e-4689-844a-b38a67f5dc98 finished (MainThread)
2017-07-22 04:44:00,003 [sunshine]  INFO: Starting scheduled job 4d55b512-1e8e-4689-844a-b38a67f5dc98 (MainThread)
2017-07-22 04:44:00,011 [sunshine]  INFO: The best practice rule 'Replication factor out of bounds' has failed. (MainThread)
...
Repair Service incremental persistence json file
Path: /opscenterd/repair_service_incremental.json
The persistence file for incremental repairs. The Repair Service periodically generates json files for job persistence. See Persisted repair state when restarting opscenterd.
{"start_timestamp": 1515614238, "job_state": "success"}Repair Service subrange persistence json file
Path: /opscenterd/repair_service_subrange.json
The persistence file for subrange repairs. The Repair Service periodically generates json files for job persistence. See Persisted repair state when restarting opscenterd.
{"start_timestamp": 1515615524, "parallel_tasks": 1, "job_state": "running"}Repair Service log
The repair_service.log records the Repair Service repair processes and configuration. For more information, see Logging for the Repair Service.
2017-08-06 16:00:41,501 [repair_service]  INFO: Initializing Repair
 Service with configuration: [('persist_directory', './repair_service/'),
('restart_period', '300'), ('cluster_stabilization_period', '30'),
('single_task_err_threshold', '10'), ('max_parallel_repairs', '0'),
('max_pending_repairs', '5'), ('single_repair_timeout', '3600'),
('min_repair_time', '5'), ('prioritization_page_size', '512'),
('offline_splits', '256'), ('min_throughput', '512'),
('num_recent_throughputs', '500'), ('error_logging_window', '86400'),
('snapshot_override', 'False'), ('ignore_keyspaces', ''), ('ignore_tables', ''),
('incremental_repair_tables', 'OpsCenter.settings, OpsCenter.backup_reports'),
('incremental_repair_datacenters', ''), ('incremental_sleep', '3600'), ('incremental_threshold', '1'),
('incremental_err_alert_threshold', '20'), ('time_to_completion_target_percentage', '65'),
('tokenranges_http_timeout', '30'), ('persist_period', '300'),
('tokenranges_partitions', '32000'), ('max_down_node_retry', '1080')] (MainThread)