Viewing TP stats in Node Details
View thread pool statistics for active, pending, completed, and blocked processes from the Node Details dialog.
View thread pool statistics for active, pending, completed, blocked, and total
blocked processes from the Node Details dialog.
Note: Thread
pools statistics can also be monitored
in the Performance Service.
Procedure
- Click .
-
In the Ring or List view, select the node to view its
details.
The Node Details dialog appears.
-
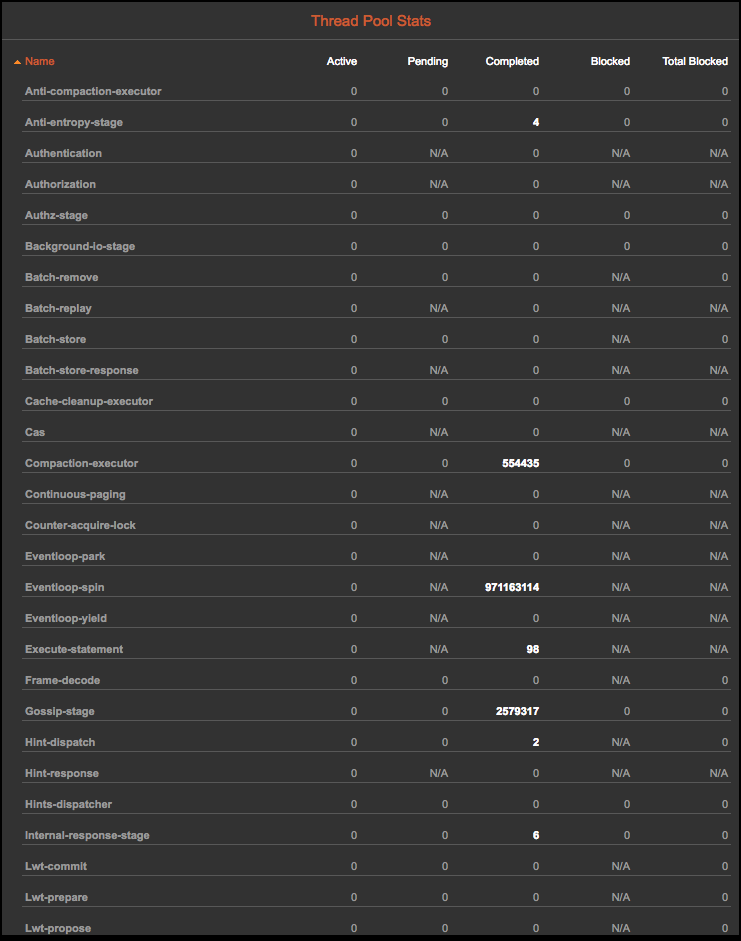
Scroll down to the Thread Pool Stats pane.
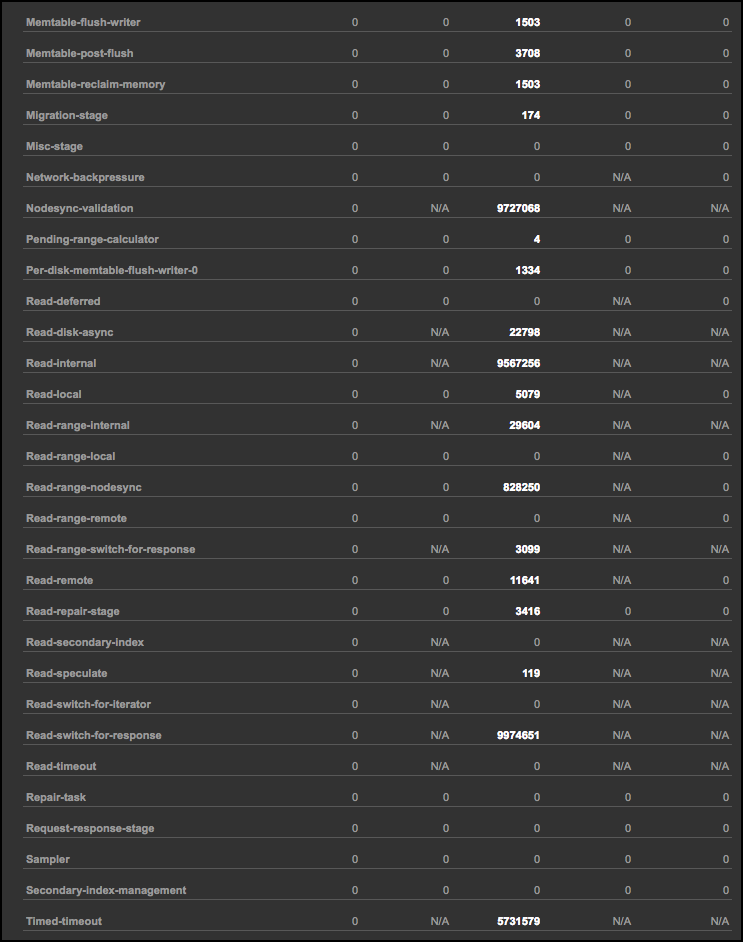
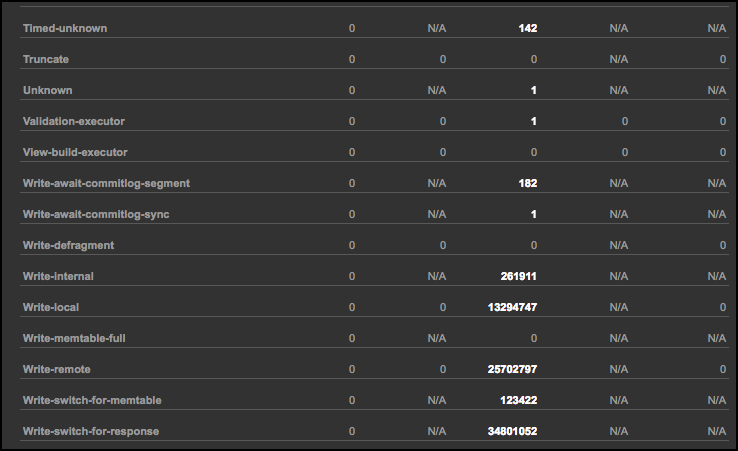
The Active, Pending, Completed, Blocked, and Total Blocked columns tally the number of threads for each metric. N/A indicates when a particular thread stage is not applicable to a metric.

There are many thread pool statistics available.

Use the scroll bar to view them in their entirety.

