DSE Graph QuickStart
DataStax StudioまたはGremlin Consoleを使用する、DSE Graph QuickStart
QuickStartの紹介
QuickStartの紹介
グラフ・データベースは、オブジェクト間の単純な関係や複雑な関係を発見する上で役立ちます。関係は、オブジェクトがオブジェクト同士およびオブジェクトの環境と対話する方法の基本となるものです。グラフ・データベースは、オブジェクト間の関係を完全に表現します。
- 頂点
- 頂点とは、人、場所、自動車、レシピ、または名詞として考えられるその他すべてのものを含むオブジェクトです。
- エッジ
- エッジは、2つの頂点の間の関係を定義します。人は、ソフトウェアを作成できます。また、作者は本を執筆することができます。通常、エッジは動詞に相当します。
- プロパティ
- 頂点またはエッジのいずれかの属性をいくつか記述したキーと値のペア。プロパティ・キーは、キーと値のペアでキーを記述するために使用します。DSE Graphではすべてのプロパティはグローバルです。これは、どの頂点についてもプロパティを使用できることを意味します。たとえば、グラフ内のすべての頂点に対して「name」というプロパティを使用できます。
プロパティ・グラフは一般的に大規模なグラフですが、グラフに対するクエリーの性質は、グラフに多数の頂点があるのか、エッジがあるのか、頂点とエッジの両方があるのかによって異なります。グラフ・データベースの概念を把握するために、わかりやすいようにサンプル・グラフを例にとってみましょう。この例では、世界の食べ物を探索します。
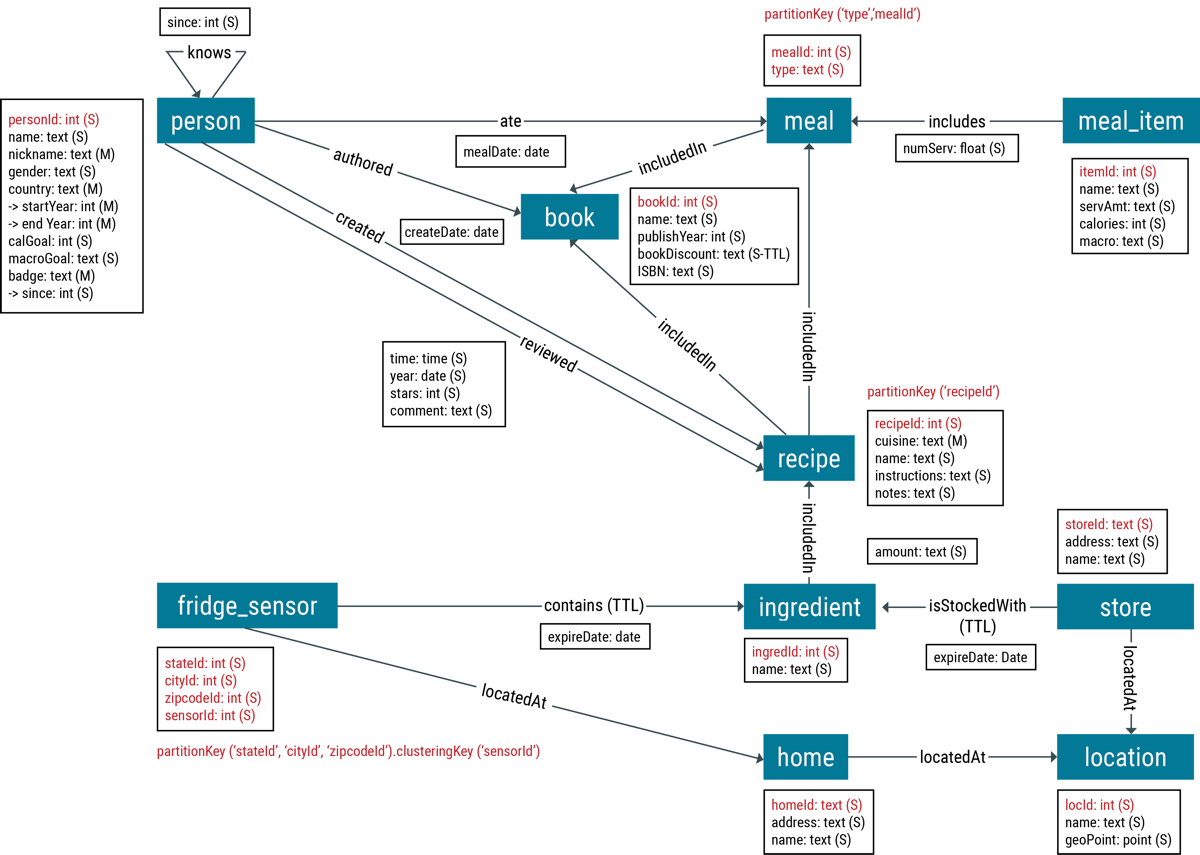
要素には、頂点ラベルとエッジ・ラベルを使用して、グラフ・データベース内の頂点およびエッジのタイプを区別するためのラベルが付けられます。personというラベルが貼られた頂点は、作成者またはレビュワー、食事をとった人物に関する情報を保持します。personとbook間のエッジには、authoredというラベルが付いています。適切なラベルを指定することは、グラフ・データ・モデリングにおける重要なステップです。
通常、頂点とエッジにはプロパティがあります。たとえば、person頂点はnameとgenderというプロパティを持つことができます。エッジもプロパティを持つことができます。createdエッジは、隣接するrecipe頂点が作成された日時を識別するcreateDateプロパティを持つ場合があります。
グラフ・データベース内の情報は、グラフ探索を使用して取得します。グラフ探索では、結果が返されるまで、定義された開始点から1つまたは一連の探索ステップによってグラフを巡回し、各ステップをフィルターします。
グラフ探索を使用して情報を取得するには、最初にデータを挿入する必要があります。以下のセクションに記載している手順に従うと、最小限の構成とスキーマ作成でDSE Graphの基礎知識を身に付けることができます。
QuickStartのインストール
DataStax EnterpriseとDataStax Studioをインストールします。
手順
- DataStax Enterpriseをインストールします。
- DSE Graphを有効にした状態で、DataStax Enterpriseを起動します。
-
DataStax StudioまたはGremlin Consoleを起動します。
QuickStartの構成
DSE Graphを構成して、QuickStartを実行します。
手順
-
Studioノートブックを作成して、QuickStart用のグラフを構成します。Gremlin Consoleを使用している場合、このステップに進みます。
-
Gremlin Consoleでグラフを作成して、QuickStart用のグラフを構成します。
QuickStartの頂点とエッジのカウント
DSE Graph内の頂点とエッジのカウント方法。
DSE Graph内で頂点とエッジのカウントを実行するには、別の方法があります。ここで取り上げる例では、トランザクション・クエリーまたは分析クエリーとしてのGremlin count()コマンドの使用方法ならびに分析クエリー用のSpark SQLを紹介します。
トランザクションGremlinクエリーを使用して、グラフ内に存在する頂点の数を確認することができます。また、小さなグラフを探索する際にも役立ちます。ただし、このタイプのクエリーはフルグラフをスキャンし、各頂点を探索することから、大きなグラフでは実行しないでください!複数のDSEノードが構成されている場合、この探索手順ではグラフ・データを含むクラスター内のすべてのノードの全パーティションを徹底的にウォークスルーします。この方法は、プロダクション運用には不向きです。
分析Gremlinクエリーを使用して、大小のグラフ内に存在する頂点の数を確認することができます。また、プロダクション運用では、安全性が格段に増します。クエリーは、トランザクションGremlinクエリーとして書き込まれますが、分析Sparkエンジンで実行されます。
Spark SQLでは、トランザクション・グラフ探索内の頂点をカウントする別のクエリー方法が利用できます。AlwaysOnSQLサービスがオンになっている場合、StudioはJDBCインターフェイスを使用してクエリーをDSE Analyticsに渡します。2つのテーブル、graphName_verticesおよびgraphName_edgesは、各グラフのSparkデータベースdse_graphで自動的に作成されます。graphNameは、Studioノートブックに割り当てられた、Studio接続に使用するグラフに置き換えられます。これらのテーブルは、一般的なSpark SQLコマンドを使用してStudioで直接クエリーを実行することも、dse spark-sqlシェルを使用して探索することもできます。Spark SQLを使用したクエリーの詳細については、ドキュメント「Spark SQLを使用したデータのクエリー」を参照してください。
手順
-
探索手順
count()を使用します。まだデータは存在していないため、現在のカウントはゼロです。すべての頂点を取得するにはグラフ探索gをV()で連結し、頂点の数を計算するにはをcount()で連結します。連結することによって、最も効率の良い順序でシーケンシャルな探索手順が実行されます。g.V().count()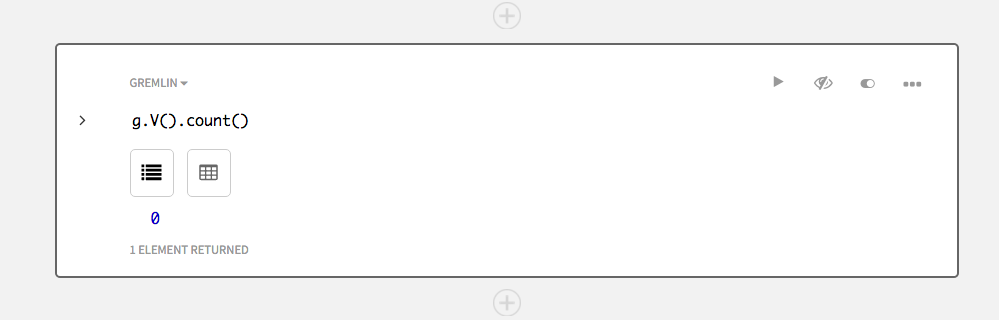
-
Gremlin Consoleを使用するには、探索を構成して分析クエリーを実行します。
:remote config alias g test.a
test.aは、グラフが分析目的用に使用されることを示します。 - Studioを使用するには、[Run]オプションを「分析エンジン(Spark)を使用して実行」に構成してから、クエリーを実行します。
-
探索手順
count()を使用します。まだデータは存在していないため、現在のカウントはゼロです。すべての頂点を取得するにはグラフ探索gをV()で連結し、頂点の数を計算するにはをcount()で連結します。連結することによって、最も効率の良い順序でシーケンシャルな探索手順が実行されます。g.V().count()
-
AlwaysOn SQLを有効にするか、Spark SQL Thriftサーバー・インスタンスを起動します。
StudioでSpark SQLを使用するには、オプションを
trueに設定して、DSEを再起動してdse.yamlファイルでAlwaysOn SQLサービスを有効にします。
Studioセルでは、セル内の言語メニューでSpark SQLを選択して、データベースをdse_graphに設定します。# AlwaysOn SQL options alwayson_sql_options: # If it's true, the node is enabled for AlwaysOn SQL. Only Analytics node # can be enabled as a AlwaysOn SQL node enabled: trueSpark SQLシェルを使用するには、シェルを起動し、dse spark-sql
適切なデータベースに移動します。USE dse_graph; -
続いて、StudioまたはSpark SQLシェルで、Spark SQLクエリーを実行して頂点カウントを検索します。
SELECT count(*) FROM DSE_GRAPH_QUICKSTART_vertices;
-
Gremlinでエッジ・カウントを行うには、
V()をE()に置換します。g.E().count() -
Spark SQLでエッジ・カウントを行うには、テーブル内の頂点という語をエッジに置換します。
SELECT count(*) FROM DSE_GRAPH_QUICKSTART_edges;
QuickStartの簡単な例
簡単なDSE Graphの例。
それでは、簡単なレシピ・データ・モデルの例から始めましょう。このデータは2つの頂点で構成されます。1つはauthor(Julia Child)であるperson、もう1つはbook(The Art of French Cooking, Vol. 1)です。これらの頂点の間にはエッジがあり、Julia Childがその本を書いたことを表しています。スキーマなしでこのグラフを作成することは可能ですが、DSE Graphはデータ型に関してベストの推測を行います。グラフ・データを挿入する前にスキーマを提供します。
次に、graph.addVertexを使用して単一の頂点のデータを追加します。ラベルの使用は、頂点ラベルを指定するためです。代替方法でご覧になれるように、g.addV文を使用することもできます。
コマンドを実行し、生JSON、テーブル、およびグラフの各ビューを表示するためのボタンを使用して結果を確認します。
手順
-
スキーマは、personId、name、ならびにgenderのプロパティで定義されています。プロパティは、最初(頂点ラベルの前)に作成されている必要があります。頂点ラベルpersonは、単一のpartitionKeyを持つユーザー定義の頂点IDを使用して、partitionKey personIdを指定します。 personIdは簡潔さを考慮して、この例では整数です。partitionKeyとプロパティを追加するためのスキーマは、2つの文で実行されますが、連続するひとつの文として実行することも可能です。
schema.propertyKey('personId').Int().single().create() schema.propertyKey('name').Text().single().create() schema.propertyKey('gender').Text().single().create() schema.vertexLabel('person').partitionKey('personId').create() schema.vertexLabel('person').properties('name','gender').add()ユーザー定義頂点IDを使用して、クラスターのノードにおけるグラフ・データをパーティションで区切ります(詳細情報)。ユーザー定義の頂点(UDV)IDを強く推奨します。自動生成される頂点IDも利用可能ですが、DSE 6.0では廃止されており、自動生成される頂点ID使用すると、警告がログに記録されます。[(ここにリンクを追加)](リンク情報)
book頂点ラベルのスキーマで示されるように、プロパティ・キーは異なる種類の情報に対して再利用できます。プロパティは複数の頂点ラベルで使用できるという点において「グローバル」ですが、グラフ探索のプロパティを指定する際、それは常に頂点ラベルと併用されるということを理解しておくことが重要です。
-
まず、
graph.addVertex()コマンドを使用して、Julia Child用に頂点を挿入します。頂点ラベルはpersonで、nameとgenderに対してキーと値のプロパティのペアが2つ作成されます。ラベルは、頂点ラベルを設定するキーと値のペアのキーを指定することに注意してください。
グラフ探索juliaChild = graph.addVertex(label,'person', 'personId', 1, 'name','Julia Child', 'gender','F')g.addVを持つ頂点を挿入するには、代替方法があります。
パフォーマンス・テストには、juliaChild = g.addV('person').property('personId', 1).property('name', 'Julia Child').property('gender', 'F')graph.addVertex()の方が高速であることが示されますが、DSEドライバーを使用して、アプリケーションでg.addVを使用することができます。Studioの結果: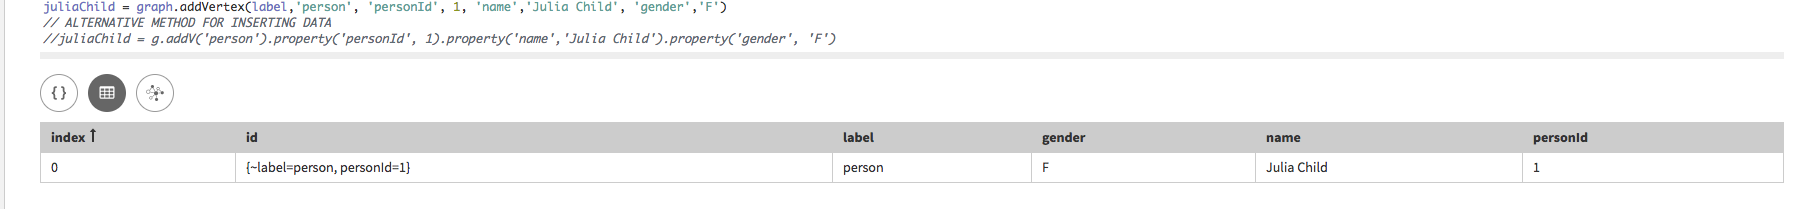 ヒント: Studioでは、次の別のビューを使用して、結果を表示させることが可能です。生JSON、テーブル、またはグラフ。オプションを探索します。Gremlin Consoleの結果:
==>v[{~label=person, personId=1}] -
単一のpartitionKey bookIdを備えたユーザー定義の頂点IDを持つラベルbook用にスキーマを作成し、name、publishYearならびにISBNのプロパティを含めます。
schema.propertyKey('bookId').Int().single().create() schema.propertyKey('publishYear').Int().single().create() schema.propertyKey('ISBN').Text().single().create() schema.vertexLabel('book').partitionKey('bookId').create() schema.vertexLabel('book').properties('name','publishYear','ISBN').add() -
グラフ内にbookを挿入します。
またはオプションで探索クエリーを挿入します。artOfFrenchCookingVolOne = graph.addVertex(label, 'book', 'bookId', 1001, 'name', 'The Art of French Cooking, Vol. 1', 'year', 1961)artOfFrenchCookingVolOne = g.addV('book').property('bookId', 1001).property('name','The Art of French Cooking, Vol. 1').property('publishYear', 1961)Studioの結果: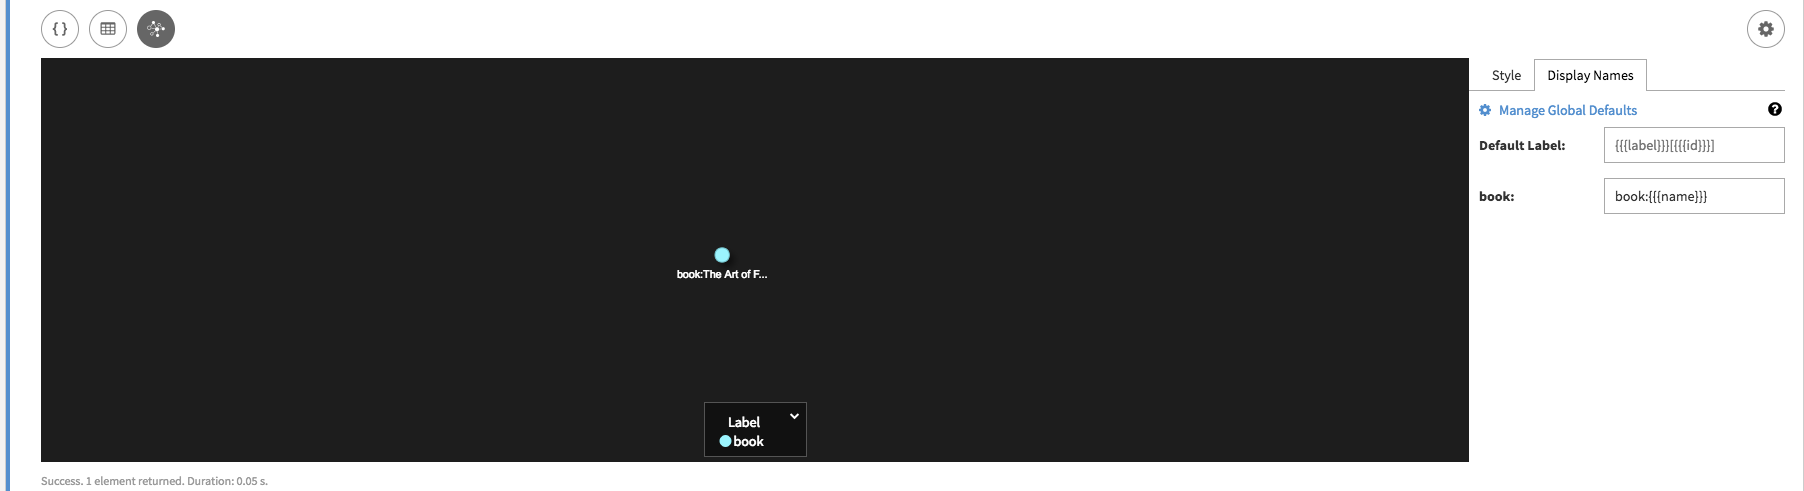
author頂点と同様に、作成したbook頂点に関するすべての情報を表示できます。[Graph]ビューで[Settings]ボタン(歯車アイコン)を使用し、
Chef {{name}}と入力してauthorの表示ラベルを変更します。{{label}}:{{name}}を使用してbookの表示ラベルを変更します。{{{name}}}を使用してbookの表示ラベルを変更します。グラフの表示名をもう少し大まかに設定するには、Studioの左上隅の3つのバーの下にある「グラフ表示名の構成」を見つけます。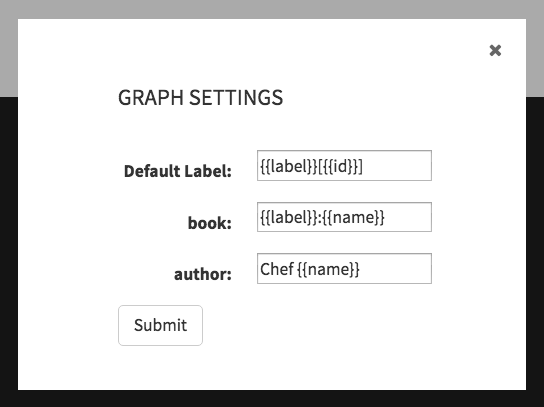 Gremlin Consoleの結果:
==>v[{~label=book, bookId=1001}] -
2つの頂点間エッジにスキーマを追加します。
schema.edgeLabel('authored').multiple().create() schema.edgeLabel('authored').connection('person', 'book').add() -
一番目のクエリーは変数
juliaChildを使用してpersonの頂点情報を保持する一方で、二番目のクエリーは、変数artOfFrenchCookingVolOneを使用してbookの頂点情報を保持します。三番目のクエリーは、グラフ探索g.V(firstVertex).addE(edgeLabel).to(secondVertex)を使用して、authorとbookの頂点の間にエッジを作成します。
以下は、グラフを使用する代替方法です。juliaChild = g.V().has('person', 'personId', 1).next() artOfFrenchCookingVolOne = g.V().has('book', 'bookId', 1001).next() g.V(juliaChild).addE('authored').to(artOfFrenchCookingVolOne)juliaChild.addEdge('authored', artOfFrenchCookingVolOne)関係を表示するには、Studioの[Graph]ビューを使用します。詳細情報を表示するには、要素上でスクロールします。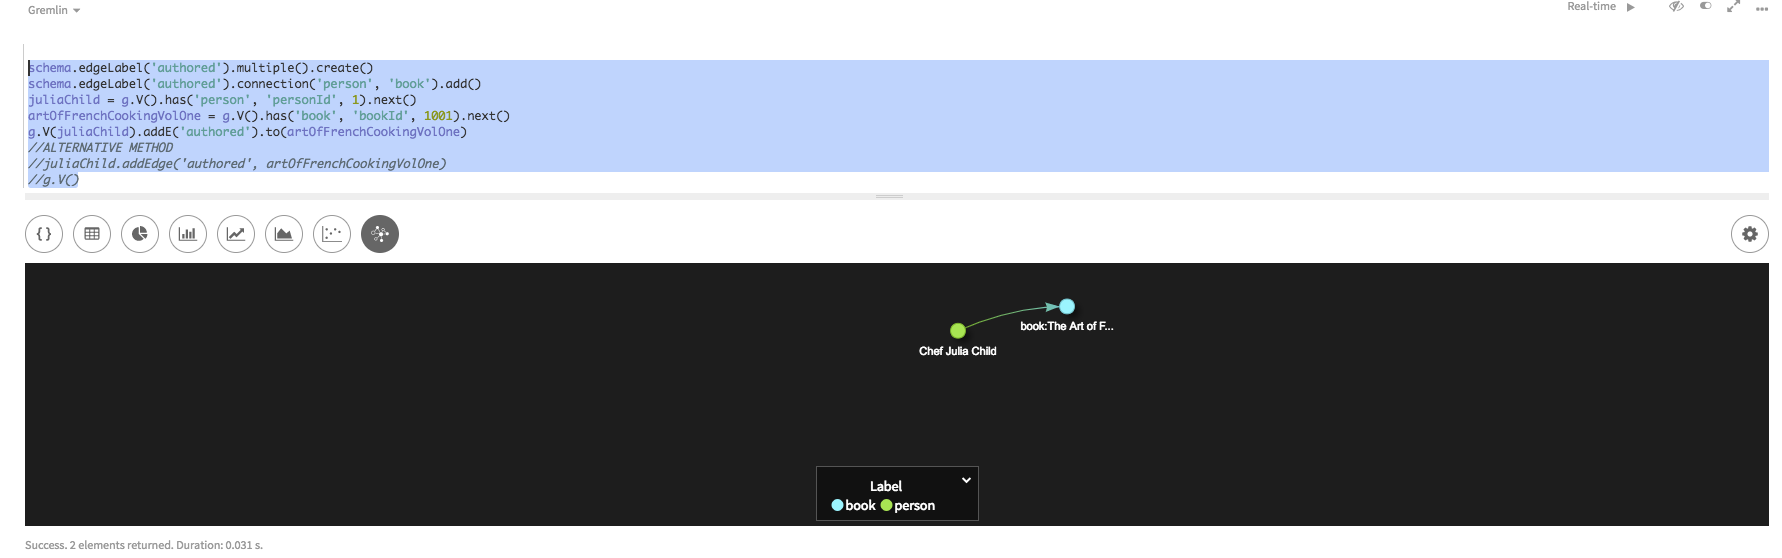 Gremlin Consoleの結果:
==>e[{~label=authored, ~out_vertex={~label=person, personId=1}, ~in_vertex={~label=book, bookId=1001}, ~local_id=5deac140-0562-11e8-a4a1-4b3271ac7767}][{~label=person, personId=1}-authored->{~label=book, bookId=1001}] -
頂点ラベル
personとプロパティname = Julia Childを使用し、has()ステップをチェックして、著者について挿入されたデータが正しいことを確認します。具体的な情報によってグラフの検索が絞り込まれるため、このグラフ探索は、さらに複雑な探索の基本的な開始点となります。g.V().has('person', 'name', 'Julia Child')Studioでは、結果を表示するために、[Raw JSON]ビューよりもはるかに見やすい[Table]ビューを使用します。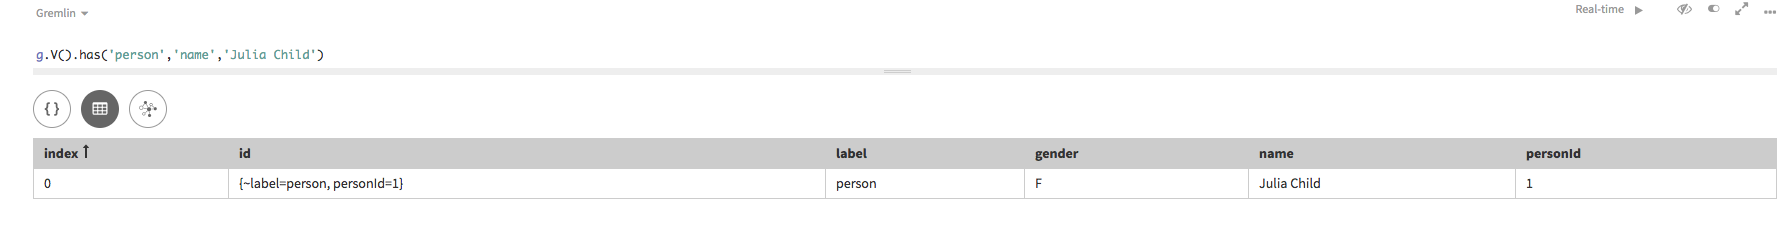
Julia Childのperson頂点の頂点情報が表示されます。IDは、ラベルとユーザー定義の頂点IDpersonIdで構成されています。Gremlin Consoleの結果:==>v[{~label=person, personId=1}] -
もう1つの有用な探索は、指定された頂点のプロパティ値ごとにキーと値のリストを出力する
valueMap()です。g.V().hasLabel('person').valueMap()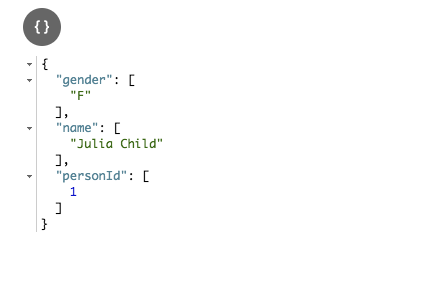 注意: クエリー対象の頂点またはエッジに非常に多くのプロパティ・キーがある場合、プロパティを指定せずに
valueMap()を指定すると、スロー・クエリーのレイテンシーが発生する可能性があります。valueMap('name')のように特定のプロパティを指定できます。 -
分析クエリーでは、Spark SQLの方が多く使用されていますが、頂点に関する情報の問い合わせなど、Gremlinに似ている単純なクエリーを作成することができます。クエリーは特定の頂点ラベルに対する特定のカラムを探すことが可能です。この場合、Julia Childという名前の人物を指します。backticksを使用して、カラム名である~labelとnameのチルダをエスケープします。
SELECT personid,name,gender FROM DSE_GRAPH_QUICKSTART_vertices WHERE `~label` = 'person' AND `name` = 'Julia Child';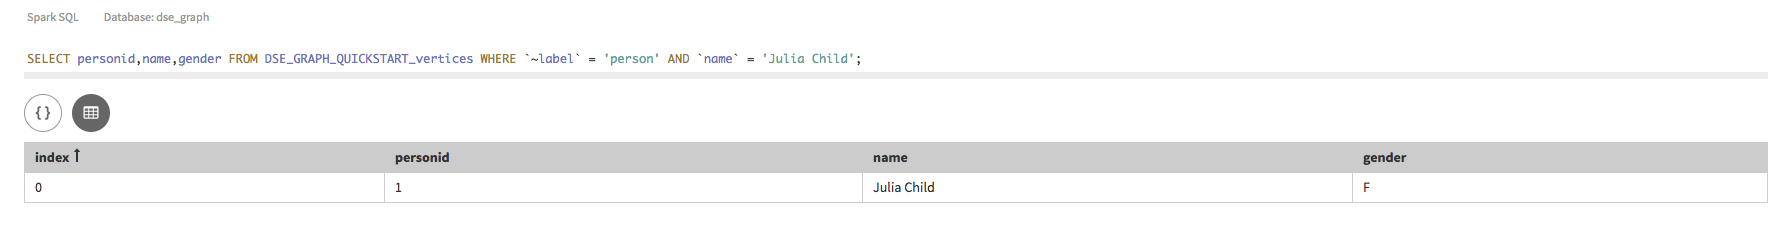
QuickStartの主な機能
DSE Graphの主な機能
ある頂点ラベル personが、頂点の種類を指定し、personIdからは頂点のクラスター・ストレージを管理するためのユーザー定義の頂点idが発行され、プロパティ・キー nameおよびgenderには人物のプロパティが表示されます。頂点ラベルを作成するでは、IDコンポーネントについて説明します。
手順
-
有用な探索は、指定された頂点のプロパティ値ごとにキーと値のリストを出力するvalueMap()です。
g.V().hasLabel('person').valueMap()注意: クエリー対象の頂点またはエッジに非常に多くのプロパティ・キーがある場合、プロパティを指定せずにvalueMap()を指定すると、スロー・クエリーのレイテンシーが発生する可能性があります。valueMap('name')のように特定のプロパティを指定できます。 -
特定のプロパティ・キーの値のみが必要な場合は、values()探索ステップを使用することができます。すべての頂点の名前を取得するには、次を使用します。
g.V().values('name')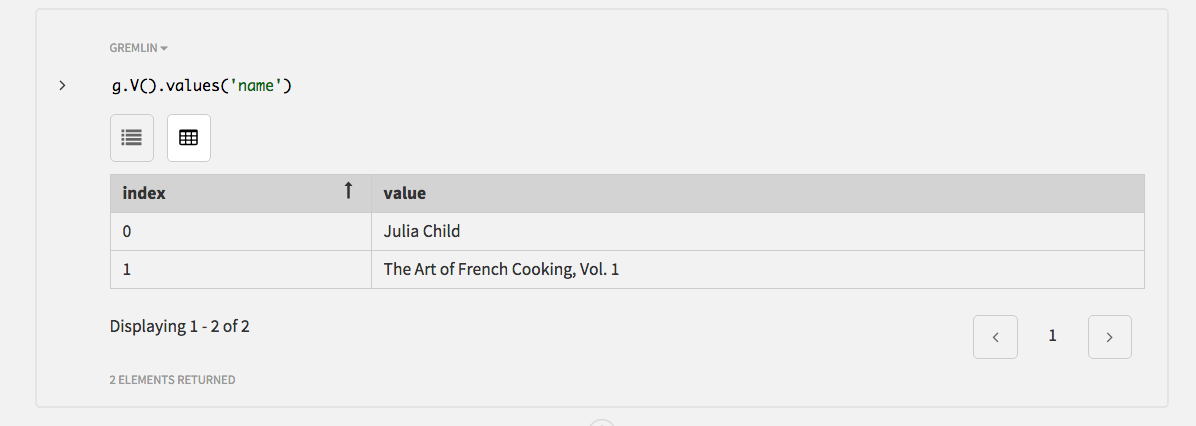
-
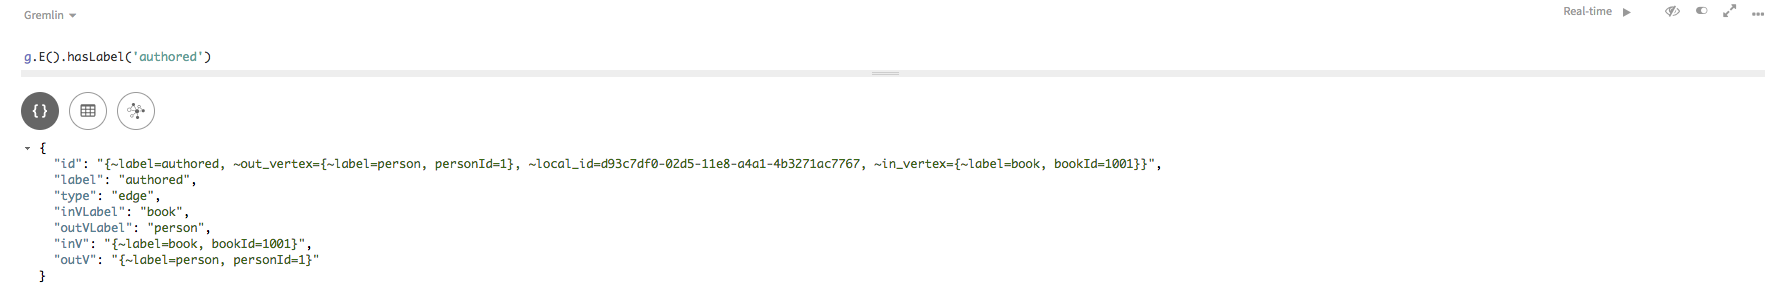
エッジの情報を取得する場合もあります。次のコマンドは、すべてのエッジをフィルター処理してエッジ・ラベル authoredを持つエッジを検索します。
g.E().hasLabel('authored')エッジ情報の[Raw JSON]ビューには、内向きおよび外向きの頂点に関する詳細のほか、エッジ・パラメーターであるid、label、およびtypeが表示されます。
 Gremlin Consoleの場合:
==>e[{~label=authored, ~out_vertex={~label=person, personId=1}, ~in_vertex={~label=book, bookId=1001}, ~local_id=5deac140-0562-11e8-a4a1-4b3271ac7767}][{~label=person, personId=1}-authored->{~label=book, bookId=1001}] -
Spark SQLは、エッジに関する情報を検索することもできます。関する情報の検索に使用することもできます。Spark生成テーブルには、Gremlinグラフ・クエリーとは異なる情報が表示されることに注意してください。探索ステップcount()は頂点の数とエッジの数の両方をカウントする場合に便利です。エッジをカウントするには、V()ではなくE()を使用します。エッジは1つであるはずです。同じ注意は、Spark SQLカウントまたはOLAPの実行というプロダクションで使用されるリアルタイム・トランザクションについても当てはまります。いずれの分析アクションも良い選択と言えます!
SELECT * FROM DSE_GRAPH_QUICKSTART_edges;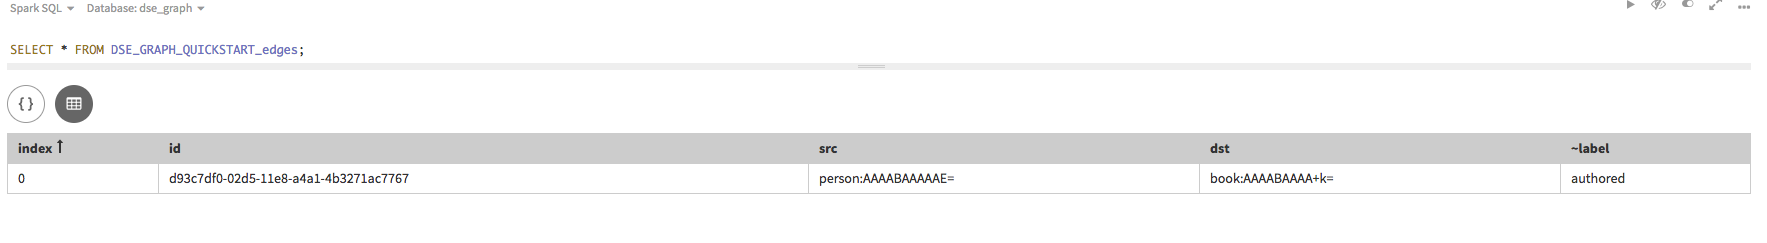
QuickStartのグラフ・スキーマ
グラフ・スキーマを設定します。
さらにデータをグラフに追加する前に、ここでスキーマについて話をしましょう。スキーマは、グラフについて考えられるプロパティとそのデータ型を定義します。これらのプロパティは、次に頂点ラベルとエッジ・ラベルの定義で使用されます。スキーマの作成における最後の重要なステップは、インデックスの作成です。インデックスは、グラフ探索の効率と速度を向上させる上で、重要な役割を果たします。詳細については、「スキーマの作成」と「インデックスの作成」を参照してください。
まず、プロパティ・キー用のスキーマを作成しましょう。次の2つのセルでは、最初のコマンドによって、以前作成した頂点とエッジのスキーマが消去されます。スキーマ作成が完了したら、次のステップで、要素のデータを長いスクリプトで再入力します。
手順
-
スキーマを消去します。
schema.drop()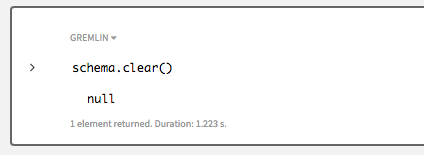
-
Spark SQLデータとグラフの同期状態を維持するには、Spark SQLテーブルを削除します。テーブルは自動的にリビルドされるため、データはグラフ・スキーマおよび追って入力するデータと整合されます。
DROP TABLE DSE_GRAPH_QUICKSTART_vertices;
DROP TABLE DSE_GRAPH_QUICKSTART_edges;
-
新しいプロパティ・キーのスキーマを作成します。
// ******** // PROPERTY KEYS // ******** // SYNTAX: // propertyKey('name'). // type(). // [ single() | multiple() ]. // [ ttl ]. // [ properties(metadata_property) ]. // [ ifNotExists() ]. // [ create() | add() | describe() | exists() ] // DEFAULT IS SINGLE CARDINALITY // ******** // SINGLE CARDINALITY PROPERTY KEY schema.propertyKey('personId').Int().single().create() schema.propertyKey('mealId').Int().single().create() schema.propertyKey('itemId').Int().single().create() schema.propertyKey('recipeId').Int().single().create() schema.propertyKey('bookId').Int().single().create() schema.propertyKey('ingredId').Int().single().create() schema.propertyKey('homeId').Int().single().create() schema.propertyKey('storeId').Int().single().create() schema.propertyKey('locId').Text().single().create() schema.propertyKey('stateId').Int().single().create() schema.propertyKey('cityId').Int().single().create() schema.propertyKey('sensorId').Int().single().create() schema.propertyKey('name').Text().single().create() schema.propertyKey('gender').Text().single().create() schema.propertyKey('calGoal').Int().single().create() schema.propertyKey('macroGoal').Text().single().create() schema.propertyKey('publishYear').Int().single().create() schema.propertyKey('ISBN').Text().single().create() schema.propertyKey('bookDiscount').Text().ttl(604800).create() schema.propertyKey('instructions').Text().single().create() schema.propertyKey('notes').Text().single().create() schema.propertyKey('type').Text().single().create() schema.propertyKey('servAmt').Text().single().create() schema.propertyKey('macro').Text().single().create() schema.propertyKey('calories').Int().single().create() schema.propertyKey('geoPoint').Point().withGeoBounds().create() schema.propertyKey('address').Text().single().create() schema.propertyKey('amount').Text().single().create() // MULTIPLE CARDINALITY PROPERTY KEY schema.propertyKey('nickname').Text().multiple().create() schema.propertyKey('cuisine').Text().multiple().create() // MULTIPLE CARDINALITY PROPERTY KEY WITH SINGLE CARDINALITY META-PROPERTY schema.propertyKey('since').Int().single().create() // meta-property schema.propertyKey('badge').Text().multiple().properties('since').create() // MULTIPLE CARDINALITY PROPERTY KEY WITH MULTIPLE CARDINALITY META-PROPERTY schema.propertyKey('startYear').Int().multiple().create() // meta-property schema.propertyKey('endYear').Int().multiple().create() // meta-property schema.propertyKey('country').Text().multiple().properties('startYear','endYear').create() // EDGE PROPERTIES schema.propertyKey('numServ').Int().single().create() schema.propertyKey('mealDate').Date().single().create() schema.propertyKey('useDate').Date().single().create() schema.propertyKey('createDate').Date().single().create() schema.propertyKey('expireDate').Date().single().create() schema.propertyKey('stars').Int().single().create() schema.propertyKey('time').Time().single().create() schema.propertyKey('year').Date().single().create() schema.propertyKey('comment').Text().single().create()各プロパティは、データ型を使用して定義する必要があります。DSE Graphデータ型は、DSEデータベースのデータ型と整合しています。デフォルトでは、プロパティには単一のカーディナリティがありますが、複数のカーディナリティを使用して定義することもできます。複数のカーディナリティを使用すると、1つのプロパティに複数の値を割り当てることができます。
また、プロパティは独自のプロパティ、つまりメタプロパティを持つことができます。メタプロパティは、1つ下のレベルにのみネストでき、個々のプロパティに情報を入力する上で役立ちます。プロパティ・キーは、
ifNotExists()メソッドを追加して作成できます。このメソッドでは、すでに存在する可能性のある定義を上書きしないようにすることができます。
-
プロパティ・キーを作成した後は、頂点ラベルを定義できます。
// ******** // VERTEX LABELS // ******** // SYNTAX: // schema.vertexLabel('vertexLabel'). // [ partitionKey(propertyKey, [ partitionKey(propertyKey) ]) ]. // [ clusteringKey(propertyKey) ]. // [ ttl ]. // [ properties(property, property) ]. // [ index ]. // [ partition() ]. // [ cache() ]. // [ ifNotExists() ]. // [ create() | add() | describe() | exists() ] // ******** // SINGLE-KEY VERTEX ID schema.vertexLabel('person').partitionKey('personId').create() schema.vertexLabel('person').properties('name','nickname','gender','calGoal','macroGoal','country').add() schema.vertexLabel('book').partitionKey('bookId').create() schema.vertexLabel('book').properties('name','publishYear','ISBN','bookDiscount').add() schema.vertexLabel('meal_item').partitionKey('itemId').create() schema.vertexLabel('meal_item').properties('name','servAmt', 'macro', 'calories').add() schema.vertexLabel('ingredient').partitionKey('ingredId').create() schema.vertexLabel('ingredient').properties('name').add() schema.vertexLabel('home').partitionKey('homeId').create() schema.vertexLabel('home').properties('name','address').add() schema.vertexLabel('store').partitionKey('storeId').create() schema.vertexLabel('store').properties('name','address').add() schema.vertexLabel('location').partitionKey('locId').create() schema.vertexLabel('location').properties('name', 'geoPoint').add() schema.vertexLabel('recipe').partitionKey('recipeId').create() schema.vertexLabel('recipe').properties('name','cuisine', 'instructions','notes').add() // MULTIPLE-KEY VERTEX ID schema.vertexLabel('meal').partitionKey('type', 'mealId').create() // COMPOSITE KEY VERTEX ID schema.vertexLabel('fridgeSensor').partitionKey('stateId', 'cityId').clusteringKey('sensorId').create() schema.vertexLabel('fridgeSensor').properties('name').add()頂点ラベル・スキーマはtypeラベルを定義し、頂点ラベルに関連付けられるプロパティをオプションで定義します。頂点ラベルを含むプロパティの関連付けを定義するために、2つのメソッドが用意されています。定義は、ラベルの作成中、または頂点ラベルの追加後に追加できます。ifNotExists()メソッドは、任意のスキーマの作成に使用できます。
自動生成される頂点IDはDSE 6.0では廃止されるため、頂点IDはユーザー定義(UDV)IDである必要があります。UDV IDについてはマニュアルでさらに詳しく説明されていますが、パーティション・キーとクラスター化キーを定義される場合があることを覚えておいてください。
DSE Graphでは、グラフごとに入力できる頂点ラベル数は200までです。
ß
-
プロパティ・キーを作成した後は、エッジ・ラベルを定義できます。
// ******** // EDGE LABELS // ******** // SYNTAX: //schema.edgeLabel('edgeLabel'). // [ single() | multiple() ]. // [ connection( outVertex, inVertex) ]. // [ ttl ]. // [ properties(property[, property]) ]. // [ ifNotExists() ]. // [ create() | add() | describe() | exists() ] // DEFAULT IS MULTIPLE CARDINALITY // ******** schema.edgeLabel('ate').multiple().create() schema.edgeLabel('ate').properties('mealDate').add() schema.edgeLabel('ate').connection('person', 'meal').add() schema.edgeLabel('knows').multiple().create() schema.edgeLabel('knows').properties('since').add() schema.edgeLabel('knows').connection('person','person').add() schema.edgeLabel('includes').multiple().create() schema.edgeLabel('includes').properties('numServ').add() schema.edgeLabel('includes').connection('meal','meal_item').add() schema.edgeLabel('includedIn').multiple().create() schema.edgeLabel('includedIn').properties('amount').add() schema.edgeLabel('includedIn').connection('recipe','meal').add() schema.edgeLabel('includedIn').connection('meal','book').add() schema.edgeLabel('includedIn').connection('recipe','book').add() schema.edgeLabel('includedIn').connection('ingredient','recipe').add() schema.edgeLabel('created').multiple().create() schema.edgeLabel('created').properties('createDate').add() schema.edgeLabel('created').connection('person', 'recipe').add() schema.edgeLabel('reviewed').multiple().create() schema.edgeLabel('reviewed').properties('time','year','stars','comment').add() schema.edgeLabel('reviewed').connection('person','recipe').add() schema.edgeLabel('authored').multiple().create() schema.edgeLabel('authored').connection('person', 'book').add() schema.edgeLabel('contains').multiple().ttl(60800).create() schema.edgeLabel('contains').properties('expireDate').add() schema.edgeLabel('contains').connection('fridgeSensor','ingredient').add() schema.edgeLabel('isStockedWith').multiple().ttl(60800).create() schema.edgeLabel('isStockedWith').properties('expireDate').add() schema.edgeLabel('isStockedWith').connection('store','ingredient').add() schema.edgeLabel('isLocatedAt').multiple().create() schema.edgeLabel('isLocatedAt').connection('home','location').add() schema.edgeLabel('isLocatedAt').connection('store','location').add() schema.edgeLabel('isLocatedAt').connection('fridgeSensor','home').add()エッジ・ラベル・スキーマは、typeラベルを定義し、
connection()を使用してエッジ・ラベルにより接続される2つの頂点ラベルを定義します。reviewedエッジ・ラベルは、外向き頂点ラベルpersonと内向き頂点ラベルrecipeを持つ隣接する頂点の間のエッジを定義します。デフォルトでは、エッジには複数のカーディナリティがありますが、1つのカーディナリティを使用してエッジを定義することができます。複数のカーディナリティを使用すると、複数のエッジに異なるプロパティ値を持たせる一方で、同じエッジ・ラベルを割り当てることができます。
QuickStartのインデックス作成
グラフ・スキーマのインデックスを作成します。
インデックス作成は、複雑で非常に重要なテーマです。ここでは、複数の種類のインデックスが作成されます。セカンダリ・インデックスとマテリアライズド・インデックスは、簡潔に言うと、DSEデータベース組み込みインデックス作成を使用した2種類のインデックスです。検索インデックスは、SolrベースのDSE Searchを使用します。1つの頂点ラベルには1つのみの検索インデックスを使用できますが、複数のプロパティを含めることができます。プロパティのインデックスを使用して、メタプロパティのインデックスを作成します。エッジ・インデックスを使用すると、エッジのプロパティのインデックスを作成できます。インデックスは、add()を使用して、以前作成した頂点ラベルに追加されます。
手順
// ********
// VERTEX INDEX
// ********
// SYNTAX:
// index('index_name').
//    [secondary() | materialized() | search()].
//    by('propertykey_name').
//    [ asText() | asString() ].
//    add()
// ********

schema.vertexLabel('person').index('byName').materialized().by('name').add()
schema.vertexLabel('meal_item').index('byName').materialized().by('name').add()
schema.vertexLabel('ingredient').index('byName').materialized().by('name').add()
//schema.vertexLabel('recipe').index('byCuisine').materialized().by('cuisine').add()
//schema.vertexLabel('book').index('byName').materialized().by('name').add()

schema.vertexLabel('meal').index('byType').secondary().by('type').add()

schema.vertexLabel('recipe').index('search').search().
  by('instructions').by('name').by('cuisine').add()
schema.vertexLabel('book').index('search').search().
  by('name').by('publishYear').add()
schema.vertexLabel('location').index('search').search().
  by('geoPoint').withError(0.000009,0.0).add()
schema.vertexLabel('store').index('search').search().by('name').add()
schema.vertexLabel('home').index('search').search().by('name').add()
schema.vertexLabel('fridgeSensor').index('search').search().
  by('cityId').by('sensorId').by('name').add()

// ********
// EDGE INDEX
// ********
// SYNTAX:
// index('index_name').
//    [outE('edgeLabel') | inE('edgeLabel') ].
//    by('propertykey_name').
//    add()
// ********

schema.vertexLabel('recipe').index('byStars').inE('reviewed').
  by('stars').ifNotExists().add()
schema.vertexLabel('person').index('ratedByStars').outE('reviewed').
  by('stars').ifNotExists().add()
schema.vertexLabel('person').index('ratedByDate').outE('reviewed').
  by('year').ifNotExists().add()
schema.vertexLabel('person').index('ratedByComments').outE('reviewed').
  by('comment').ifNotExists().add()
schema.vertexLabel('recipe').index('byPersonOrRecipe').bothE('created').
  by('createDate').ifNotExists().add()

// ********
// PROPERTY INDEX using meta-property 'livedIn'
// ********
// SYNTAX:
// index('index_name').
//    property('propertykey_name').
//    by('meta-propertykey_name').
//    add()
// ********

schema.vertexLabel('person').index('byStartYear').
  property('country').by('startYear').add()
schema.vertexLabel('person').index('byEndYear').
  property('country').by('endYear').add()
QuickStartの検査スキーマ
グラフ・スキーマを検査します。
schema.describe()クエリーは、入力したスキーマの再作成に使用できるスキーマを表示します。スキーマを作成せずにデータを入力する場合は、このコマンドを使用して、プロパティごとに設定されているデータ型を確認できます。
手順
-
スキーマを確認します。
schema.describe()Studioでは、出力の一部です。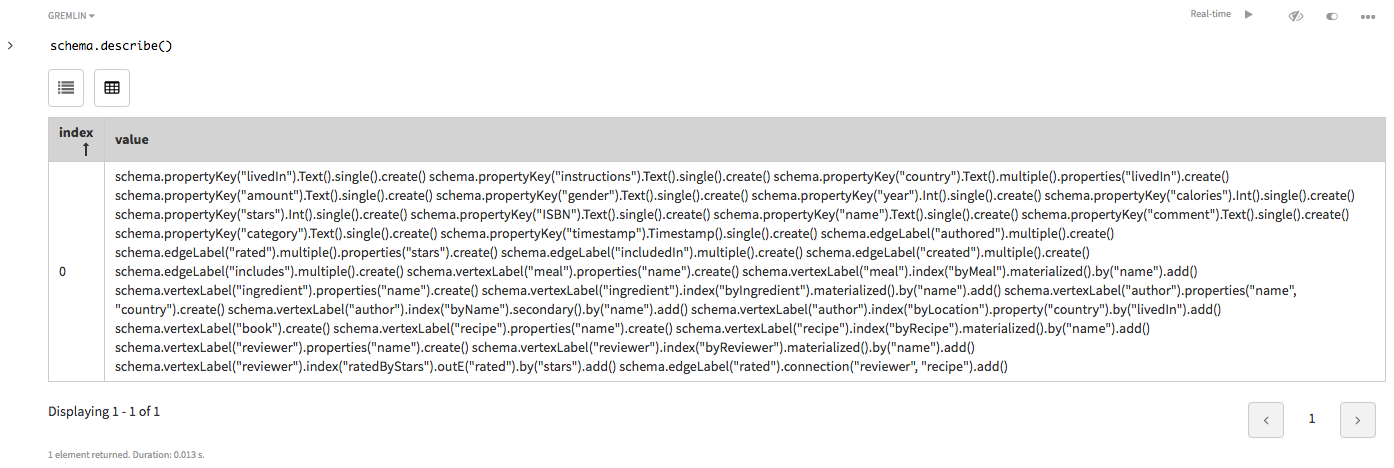
schema.describe()クエリーは、入力したスキーマの再作成に使用できるスキーマを表示します。スキーマを作成せずにデータを入力する場合は、このコマンドを使用して、プロパティごとに設定されているデータ型を確認できます。開発中および学習時はスキーマを作成せずにデータを入力すると便利ですが、実際のアプリケーションではそれを行わないことを強くお勧めします。このため、Productionモードではデータの読み込み後にスキーマを作成できないようになっています。 -
Gremlinクエリーでは、特定のスキーマ記述を見つけるためにいくつかのGroovyの手順が役立ちます。たとえば、頂点ラベルとそのインデックスのスキーマだけを検索する際、以下のコマンドを使用します。
schema.describe().split('\n').grep(~/.*vertexLabel.*/)Studioの場合: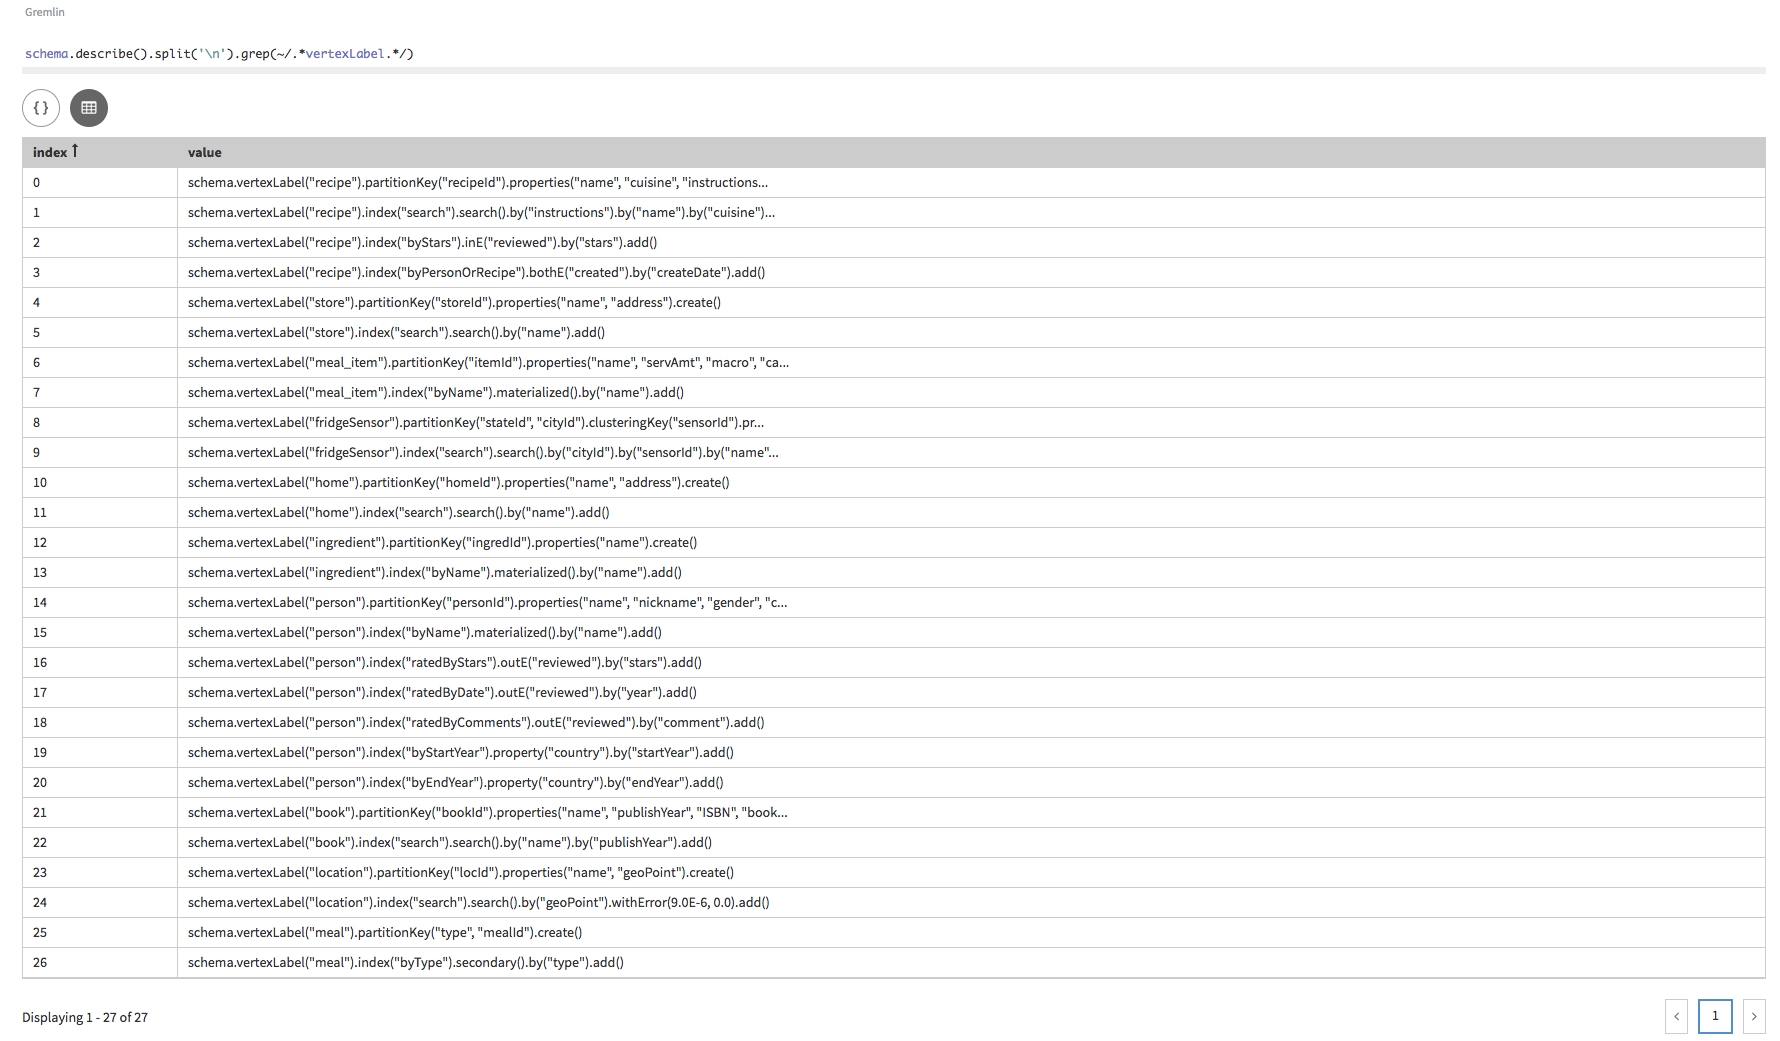 Gremlin Consoleの場合:
==>schema.vertexLabel("recipe").partitionKey("recipeId").properties("name", "cuisine", "instructions", "notes").create()
==>schema.vertexLabel("recipe").index("search").search().by("instructions").by("name").by("cuisine").add()
==>schema.vertexLabel("recipe").index("byStars").inE("reviewed").by("stars").add()
==>schema.vertexLabel("recipe").index("byPersonOrRecipe").bothE("created").by("createDate").add()
==>schema.vertexLabel("store").partitionKey("storeId").properties("name", "address").create()
==>schema.vertexLabel("store").index("search").search().by("name").add()
==>schema.vertexLabel("meal_item").partitionKey("itemId").properties("name", "servAmt", "macro", "calories").create()
==>schema.vertexLabel("meal_item").index("byName").materialized().by("name").add()
==>schema.vertexLabel("fridgeSensor").partitionKey("stateId", "cityId").clusteringKey("sensorId").properties("name").create()
==>schema.vertexLabel("fridgeSensor").index("search").search().by("cityId").by("sensorId").by("name").add()
==>schema.vertexLabel("home").partitionKey("homeId").properties("name", "address").create()
==>schema.vertexLabel("home").index("search").search().by("name").add()
==>schema.vertexLabel("ingredient").partitionKey("ingredId").properties("name").create()
==>schema.vertexLabel("ingredient").index("byName").materialized().by("name").add()
==>schema.vertexLabel("person").partitionKey("personId").properties("name", "nickname", "gender", "calGoal", "macroGoal", "country").create()
==>schema.vertexLabel("person").index("byName").materialized().by("name").add()
==>schema.vertexLabel("person").index("ratedByStars").outE("reviewed").by("stars").add()
==>schema.vertexLabel("person").index("ratedByDate").outE("reviewed").by("year").add()
==>schema.vertexLabel("person").index("ratedByComments").outE("reviewed").by("comment").add()
==>schema.vertexLabel("person").index("byStartYear").property("country").by("startYear").add()
==>schema.vertexLabel("person").index("byEndYear").property("country").by("endYear").add()
==>schema.vertexLabel("book").partitionKey("bookId").properties("name", "publishYear", "ISBN", "bookDiscount").create()
==>schema.vertexLabel("book").index("search").search().by("name").by("publishYear").add()
==>schema.vertexLabel("location").partitionKey("locId").properties("name", "geoPoint").create()
==>schema.vertexLabel("location").index("search").search().by("geoPoint").withError(9.0E-6, 0.0).add()
==>schema.vertexLabel("meal").partitionKey("type", "mealId").create()
==>schema.vertexLabel("meal").index("byType").secondary().by("type").add()
ステップを追加すると、出力が改行で分割され、
indexで示されるような文字列をグレップ検索できます。ここで使用するGremlinバリアントは、Apache Groovyをベースとしているため、グラフ探索の操作にはどのようなGroovyコマンドでも使用できます。Apache Groovyは、Javaをスムーズに統合してスクリプト記述機能を提供する言語です。
QuickStartのスキーマの変更
グラフ・スキーマを変更します。
スキーマは上記のスキーマ作成でご覧になれるように、add()というスキーマを使用して追加のプロパティ、頂点ラベル、エッジ・ラベルまたはをインデックスを追加して作成後に変更可能です。drop()ステップを使用して、要素を削除することも可能です。propertyKey、vertexLabel、ならびにedgeLabelを参照してください。ただし、プロパティのデータ型は、プロパティを削除したり、再作成したりすることなく変更できません。スキーマを作成せずにデータを入力する方法は、開発および学習時には有効ですが、実際のアプリケーションにおいてはお勧めしないことを強調しておきます。このため、Productionモードではデータの読み込み後にスキーマを作成できないようになっています。
手順
-
次のステップで削除するプロパティを作成します。
schema.propertyKey('nonsenseToDrop').Int().single().create()
schema.describe().split('\n').grep(~/.*nonsenseToDrop.*/)
Studioの場合: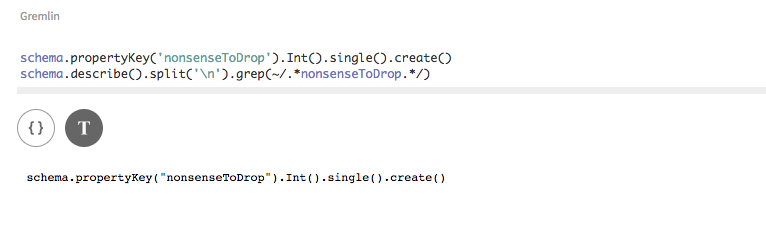
-
プロパティを削除します。
schema.propertyKey('nonsenseToDrop').drop()
schema.describe().split('\n').grep(~/.*nonsenseToDrop.*/)
Studioの場合: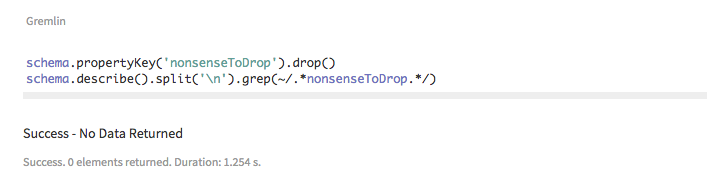
QuickStartによるデータの追加
グラフへのデータの追加
これでスキーマが作成されたため、次のスクリプトを使用してさらに頂点とエッジを追加します。recipeデータ・モデルでさらに多くの接続を検証するために、より多くの頂点とエッジをグラフに入力します。generateRecipe.groovyというスクリプトが入力されてから、リモートGremlin Serverによって実行されます。最初のコマンドg.V().drop().iterate()に注目してください。このコマンドを使用して、新しいデータを読み込む前に、すべての頂点とエッジのデータをグラフから削除することができます。Studioでは、スクリプト実行後は、必ず[Graph]ビューを選択してください。
手順
-
StudioまたはGremlin Consoleで、generateRecipe.groovyを実行します。
Gremlin Consoleで実行する場合、次のコマンドを使用して読み込みます。
:load /tmp/generateRecipe.groovy
"/tmp"は、スクリプトを作成したディレクトリーに置き換えます。Studioでは、セル内でスクリプトを実行します。// Generates all Recipe Toy Graph vertices and edges except Reviews // Add all vertices and edges for Recipe g.V().drop().iterate() // author vertices juliaChild = graph.addVertex(label, 'person', 'personId', 1, 'name','Julia Child', 'gender', 'F') simoneBeck = graph.addVertex(label, 'person', 'personId', 2, 'name', 'Simone Beck', 'gender', 'F') louisetteBertholie = graph.addVertex(label, 'person', 'personId', 3, 'name', 'Louisette Bertholie', 'gender', 'F') patriciaSimon = graph.addVertex(label, 'person', 'personId', 4, 'name', 'Patricia Simon', 'gender', 'F') aliceWaters = graph.addVertex(label, 'person', 'personId', 5, 'name', 'Alice Waters', 'gender', 'F') patriciaCurtan = graph.addVertex(label, 'person', 'personId', 6, 'name', 'Patricia Curtan', 'gender', 'F') kelsieKerr = graph.addVertex(label, 'person', 'personId', 7, 'name', 'Kelsie Kerr', 'gender', 'F') fritzStreiff = graph.addVertex(label, 'person', 'personId', 8, 'name', 'Fritz Streiff', 'gender', 'M') emerilLagasse = graph.addVertex(label, 'person', 'personId', 9, 'name', 'Emeril Lagasse', 'gender', 'M') jamesBeard = graph.addVertex(label, 'person', 'personId', 10, 'name', 'James Beard', 'gender', 'M') // book vertices artOfFrenchCookingVolOne = graph.addVertex(label, 'book', 'bookId', 1001, 'name', 'The Art of French Cooking, Vol. 1', 'publishYear', 1961) simcasCuisine = graph.addVertex(label, 'book', 'bookId', 1002, 'name', "Simca's Cuisine: 100 Classic French Recipes for Every Occasion", 'publishYear', 1972, 'ISBN', '0-394-40152-2') frenchChefCookbook = graph.addVertex(label, 'book', 'bookId', 1003, 'name','The French Chef Cookbook', 'publishYear', 1968, 'ISBN', '0-394-40135-2') artOfSimpleFood = graph.addVertex(label, 'book', 'bookId', 1004, 'name', 'The Art of Simple Food: Notes, Lessons, and Recipes from a Delicious Revolution', 'publishYear', 2007, 'ISBN', '0-307-33679-4') // recipe vertices beefBourguignon = graph.addVertex(label, 'recipe', 'recipeId', 2001, 'name', 'Beef Bourguignon', 'instructions', 'Braise the beef. Saute the onions and carrots. Add wine and cook in a dutch oven at 425 degrees for 1 hour.', 'notes', 'Takes a long time to make.') ratatouille = graph.addVertex(label, 'recipe', 'recipeId', 2002, 'name', 'Rataouille', 'instructions', 'Peel and cut the egglant. Make sure you cut eggplant into lengthwise slices that are about 1-inch wmyIde, 3-inches long, and 3/8-inch thick', 'notes', "I've made this 13 times.") saladeNicoise = graph.addVertex(label, 'recipe', 'recipeId', 2003, 'name', 'Salade Nicoise', 'instructions', 'Take a salad bowl or platter and line it with lettuce leaves, shortly before serving. Drizzle some olive oil on the leaves and dust them with salt.', 'notes', '') wildMushroomStroganoff = graph.addVertex(label, 'recipe', 'recipeId', 2004, 'name', 'Wild Mushroom Stroganoff', 'instructions', 'Cook the egg noodles according to the package directions and keep warm. Heat 1 1/2 tablespoons of the oliveoil in a large saute pan over medium-high heat.', 'notes', 'Good for Jan and Bill.') spicyMeatloaf = graph.addVertex(label, 'recipe', 'recipeId', 2005, 'name', 'Spicy Meatloaf', 'instructions', 'Preheat the oven to 375 degrees F. Cook bacon in a large skillet over medium heat until very crisp and fat has rendered, 8-10 minutes.', 'notes', ' ') oystersRockefeller = graph.addVertex(label, 'recipe', 'recipeId', 2006, 'name', 'Oysters Rockefeller', 'instructions', 'Saute the shallots, celery, herbs, and seasonings in 3 tablespoons of the butter for 3 minutes. Add the watercress and let it wilt.', 'notes', ' ') carrotSoup = graph.addVertex(label, 'recipe', 'recipeId', 2007, 'name', 'Carrot Soup', 'instructions', 'In a heavy-bottomed pot, melt the butter. When it starts to foam, add the onions and thyme and cook over medium-low heat until tender, about 10 minutes.', 'notes', 'Quick and easy.') roastPorkLoin = graph.addVertex(label, 'recipe', 'recipeId', 2008, 'name', 'Roast Pork Loin', 'instructions', 'The day before, separate the meat from the ribs, stopping about 1 inch before the end of the bones. Season the pork liberally inside and out with salt and pepper and refrigerate overnight.', 'notes', 'Love this one!') // ingredients vertices beef = graph.addVertex(label, 'ingredient', 'ingredId', 3001, 'name', 'beef') onion = graph.addVertex(label, 'ingredient', 'ingredId', 3002, 'name', 'onion') mashedGarlic = graph.addVertex(label, 'ingredient', 'ingredId', 3003, 'name', 'mashed garlic') butter = graph.addVertex(label, 'ingredient', 'ingredId', 3004, 'name', 'butter') tomatoPaste = graph.addVertex(label, 'ingredient', 'ingredId', 3005, 'name', 'tomato paste') eggplant = graph.addVertex(label, 'ingredient', 'ingredId', 3006, 'name', 'eggplant') zucchini = graph.addVertex(label, 'ingredient', 'ingredId', 3007, 'name', 'zucchini') oliveOil = graph.addVertex(label, 'ingredient', 'ingredId', 3008, 'name', 'olive oil') yellowOnion = graph.addVertex(label, 'ingredient', 'ingredId', 3009, 'name', 'yellow onion') greenBean = graph.addVertex(label, 'ingredient', 'ingredId', 3010, 'name', 'green beans') tuna = graph.addVertex(label, 'ingredient', 'ingredId', 3011, 'name', 'tuna') tomato = graph.addVertex(label, 'ingredient', 'ingredId', 3012, 'name', 'tomato') hardBoiledEgg = graph.addVertex(label, 'ingredient', 'ingredId', 3013, 'name', 'hard-boiled egg') eggNoodles = graph.addVertex(label, 'ingredient', 'ingredId', 3014, 'name', 'egg noodles') mushroom = graph.addVertex(label, 'ingredient', 'ingredId', 3015, 'name', 'mushrooms') bacon = graph.addVertex(label, 'ingredient', 'ingredId', 3016, 'name', 'bacon') celery = graph.addVertex(label, 'ingredient', 'ingredId', 3017, 'name', 'celery') greenBellPepper = graph.addVertex(label, 'ingredient', 'ingredId', 3018, 'name', 'green bell pepper') groundBeef = graph.addVertex(label, 'ingredient', 'ingredId', 3019, 'name', 'ground beef') porkSausage = graph.addVertex(label, 'ingredient', 'ingredId', 3020, 'name', 'pork sausage') shallot = graph.addVertex(label, 'ingredient', 'ingredId', 3021, 'name', 'shallots') chervil = graph.addVertex(label, 'ingredient', 'ingredId', 3022, 'name', 'chervil') fennel = graph.addVertex(label, 'ingredient', 'ingredId', 3023, 'name', 'fennel') parsley = graph.addVertex(label, 'ingredient', 'ingredId', 3024, 'name', 'parsley') oyster = graph.addVertex(label, 'ingredient', 'ingredId', 3025, 'name', 'oyster') pernod = graph.addVertex(label, 'ingredient', 'ingredId', 3026, 'name', 'Pernod') thyme = graph.addVertex(label, 'ingredient', 'ingredId', 3027, 'name', 'thyme') carrot = graph.addVertex(label, 'ingredient', 'ingredId', 3028, 'name', 'carrots') chickenBroth = graph.addVertex(label, 'ingredient', 'ingredId', 3029, 'name', 'chicken broth') porkLoin = graph.addVertex(label, 'ingredient', 'ingredId', 3030, 'name', 'pork loin') redWine = graph.addVertex(label, 'ingredient', 'ingredId', 3031, 'name', 'red wine') // meal vertices meal1 = graph.addVertex(label, 'meal', 'mealId', 4001, 'type', 'lunch') meal2 = graph.addVertex(label, 'meal', 'mealId', 4002, 'type', 'lunch') meal3 = graph.addVertex(label, 'meal', 'mealId', 4003, 'type', 'lunch') meal4 = graph.addVertex(label, 'meal', 'mealId', 4004, 'type', 'lunch') meal5 = graph.addVertex(label, 'meal', 'mealId', 4005, 'type', 'breakfast') meal6 = graph.addVertex(label, 'meal', 'mealId', 4006, 'type', 'snack') meal7 = graph.addVertex(label, 'meal', 'mealId', 4007, 'type', 'dinner') meal8 = graph.addVertex(label, 'meal', 'mealId', 4008, 'type', 'dinner') // author-book edges juliaChild.addEdge('authored', artOfFrenchCookingVolOne) simoneBeck.addEdge('authored', artOfFrenchCookingVolOne) louisetteBertholie.addEdge('authored', artOfFrenchCookingVolOne) simoneBeck.addEdge('authored', simcasCuisine) patriciaSimon.addEdge('authored', simcasCuisine) juliaChild.addEdge('authored', frenchChefCookbook) aliceWaters.addEdge('authored', artOfSimpleFood) patriciaCurtan.addEdge('authored', artOfSimpleFood) kelsieKerr.addEdge('authored', artOfSimpleFood) fritzStreiff.addEdge('authored', artOfSimpleFood) // author - recipe edges juliaChild.addEdge('created', beefBourguignon, 'createDate', 1961-01-01) juliaChild.addEdge('created', ratatouille, 'createDate', 1965-02-02) juliaChild.addEdge('created', saladeNicoise, 'createDate', 1962-03-03) emerilLagasse.addEdge('created', wildMushroomStroganoff, 'createDate', 2003-04-04) emerilLagasse.addEdge('created', spicyMeatloaf, 'createDate', 2000-05-05) aliceWaters.addEdge('created', carrotSoup, 'createDate', 1995-06-06) aliceWaters.addEdge('created', roastPorkLoin, 'createDate', 1996-07-07) jamesBeard.addEdge('created', oystersRockefeller, 'createDate', 1970-01-01) // recipe - ingredient edges beefBourguignon.addEdge('includedIn', beef, 'amount', '2 lbs') beefBourguignon.addEdge('includedIn', onion, 'amount', '1 sliced') beefBourguignon.addEdge('includedIn', mashedGarlic, 'amount', '2 cloves') beefBourguignon.addEdge('includedIn', butter, 'amount', '3.5 Tbsp') beefBourguignon.addEdge('includedIn', tomatoPaste, 'amount', '1 Tbsp') ratatouille.addEdge('includedIn', eggplant, 'amount', '1 lb') ratatouille.addEdge('includedIn', zucchini, 'amount', '1 lb') ratatouille.addEdge('includedIn', mashedGarlic, 'amount', '2 cloves') ratatouille.addEdge('includedIn', oliveOil, 'amount', '4-6 Tbsp') ratatouille.addEdge('includedIn', yellowOnion, 'amount', '1 1/2 cups or 1/2 lb thinly sliced') saladeNicoise.addEdge('includedIn', oliveOil, 'amount', '2-3 Tbsp') saladeNicoise.addEdge('includedIn', greenBean, 'amount', '1 1/2 lbs blanched, trimmed') saladeNicoise.addEdge('includedIn', tuna, 'amount', '8-10 ozs oil-packed, drained and flaked') saladeNicoise.addEdge('includedIn', tomato, 'amount', '3 or 4 red, peeled, quartered, cored, and seasoned') saladeNicoise.addEdge('includedIn', hardBoiledEgg, 'amount', '8 halved lengthwise') wildMushroomStroganoff.addEdge('includedIn', eggNoodles, 'amount', '16 ozs wmyIde') wildMushroomStroganoff.addEdge('includedIn', mushroom, 'amount', '2 lbs wild or exotic, cleaned, stemmed, and sliced') wildMushroomStroganoff.addEdge('includedIn', yellowOnion, 'amount', '1 cup thinly sliced') spicyMeatloaf.addEdge('includedIn', bacon, 'amount', '3 ozs diced') spicyMeatloaf.addEdge('includedIn', onion, 'amount', '2 cups finely chopped') spicyMeatloaf.addEdge('includedIn', celery, 'amount', '2 cups finely chopped') spicyMeatloaf.addEdge('includedIn', greenBellPepper, 'amount', '1/4 cup finely chopped') spicyMeatloaf.addEdge('includedIn', porkSausage, 'amount', '3/4 lbs hot') spicyMeatloaf.addEdge('includedIn', groundBeef, 'amount', '1 1/2 lbs chuck') oystersRockefeller.addEdge('includedIn', shallot, 'amount', '1/4 cup chopped') oystersRockefeller.addEdge('includedIn', celery, 'amount', '1/4 cup chopped') oystersRockefeller.addEdge('includedIn', chervil, 'amount', '1 tsp') oystersRockefeller.addEdge('includedIn', fennel, 'amount', '1/3 cup chopped') oystersRockefeller.addEdge('includedIn', parsley, 'amount', '1/3 cup chopped') oystersRockefeller.addEdge('includedIn', oyster, 'amount', '2 dozen on the half shell') oystersRockefeller.addEdge('includedIn', pernod, 'amount', '1/3 cup') carrotSoup.addEdge('includedIn', butter, 'amount', '4 Tbsp') carrotSoup.addEdge('includedIn', onion, 'amount', '2 medium sliced') carrotSoup.addEdge('includedIn', thyme, 'amount', '1 sprig') carrotSoup.addEdge('includedIn', carrot, 'amount', '2 1/2 lbs, peeled and sliced') carrotSoup.addEdge('includedIn', chickenBroth, 'amount', '6 cups') roastPorkLoin.addEdge('includedIn', porkLoin, 'amount', '1 bone-in, 4-rib') roastPorkLoin.addEdge('includedIn', redWine, 'amount', '1/2 cup') roastPorkLoin.addEdge('includedIn', chickenBroth, 'amount', '1 cup') // book - recipe edges beefBourguignon.addEdge('includedIn', artOfFrenchCookingVolOne) saladeNicoise.addEdge('includedIn', artOfFrenchCookingVolOne) carrotSoup.addEdge('includedIn', artOfSimpleFood) // meal - recipe edges beefBourguignon.addEdge('includedIn', meal1) saladeNicoise.addEdge('includedIn', meal1) carrotSoup.addEdge('includedIn', meal4) roastPorkLoin.addEdge('includedIn', meal4) // meal - book edges meal7.addEdge('includedIn', artOfFrenchCookingVolOne) meal8.addEdge('includedIn', artOfSimpleFood) meal5.addEdge('includedIn', frenchChefCookbook) g.V()Studioの場合:図 2. レシピ・サンプル・グラフのデータ 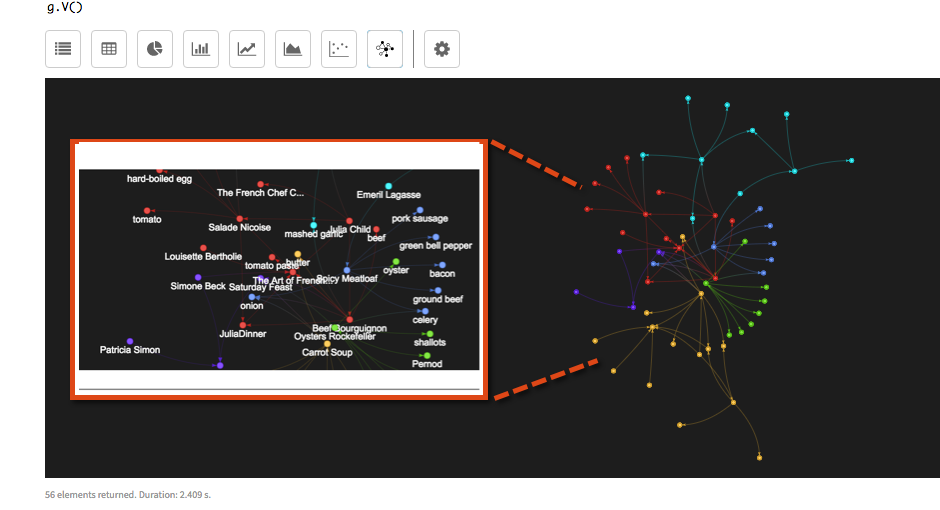
g.V()コマンドは、作成されたすべての頂点を表示します。Gremlin Consoleの場合:// A series of returns for vertices and edges will mark the successful completion of the script // Sample vertex ==>v[{~label=meal, type="dinner", mealId=4008}] // Sample edge ==>e[{~label=includedIn, ~out_vertex={~label=meal, type="dinner", mealId=4008}, ~in_vertex={~label=book, bookId=1004}, ~local_id=5dec6ef7-0562-11e8-a4a1-4b3271ac7767}] [{~label=meal, type="dinner", mealId=4008}-includedIn->{~label=book, bookId=1004}] -
トランザクション・クエリーまたは分析クエリーとして頂点カウントを実行すると、頂点のカウント数が61に増えます。頂点カウントを再実行します。
g.V().count()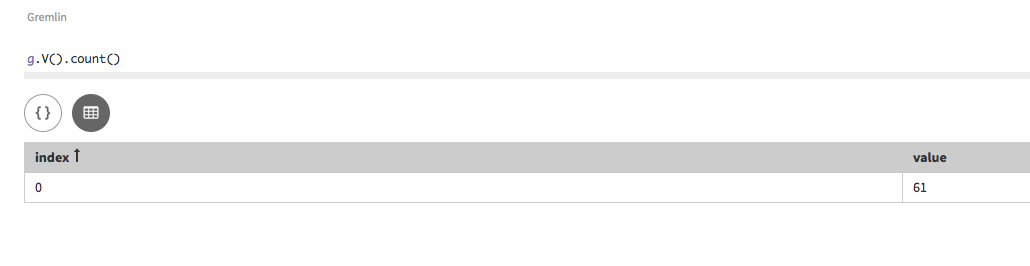
データを読み込むためのスクリプト記述には、DSE Graph Loaderを推奨します。
graph.addVertexまたはg.addV()の使用が実用的なのは、レシピの例のようなサイズの小さいトーイ・グラフに限られます。 -
同様に、エッジ・カウントは実行可能で、エッジ・カウント数が67に増えます。
g.E().count()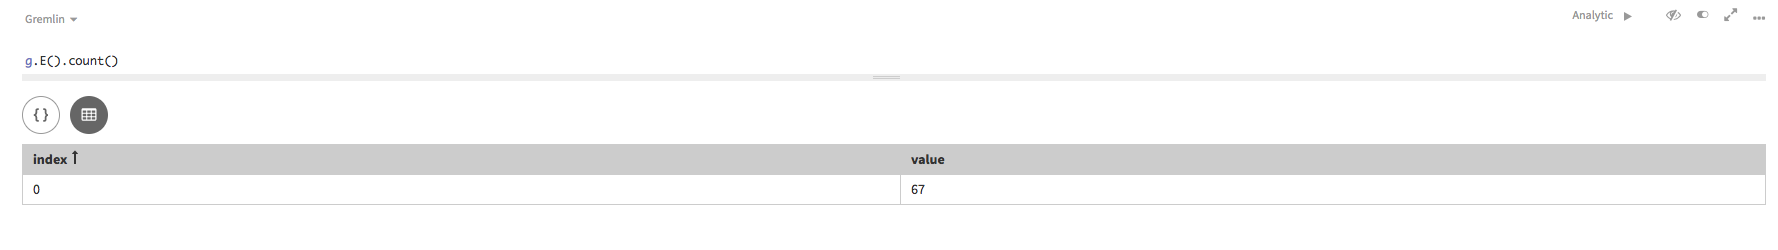
QuickStartの探索機能
クエリー探索を使用して、グラフ・データを探索します。
グラフ探索を使用してグラフを探索すると、興味深い結論が得られることがあります。ここでは、多数の探索を探索して、単純なクエリー作成におけるGremlinの能力を紹介します。
手順
-
クエリーをプロファイルして、クエリー・パスやクエリーの実行方法を確認することができます。
g.V().has('person', 'name', 'Julia Child').profile()Studioの場合: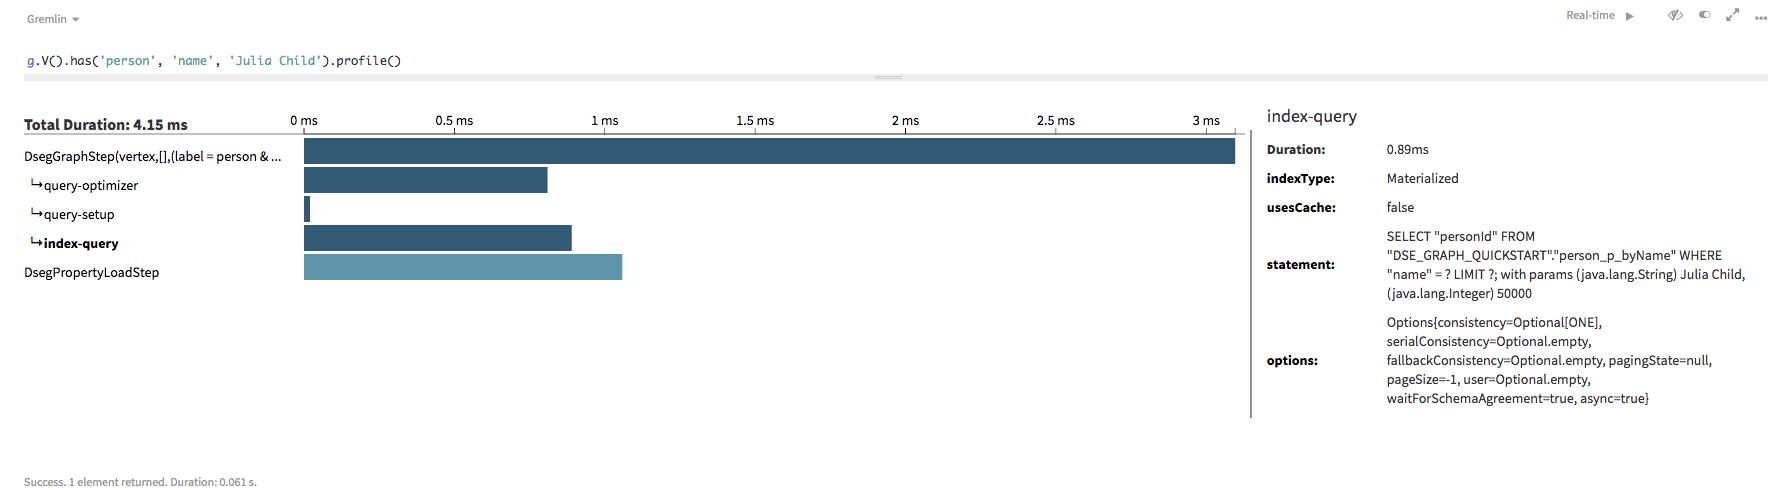 Gremlin Consoleの場合:
==>Traversal Metrics Step Count Traversers Time (ms) % Dur ============================================================================================================= DsegGraphStep(vertex,[],(label = person & name ... 1 1 10.097 65.69 query-optimizer 1.848 \_condition=((label = person & name = Julia Child) & (true)) query-setup 0.065 \_isFitted=true \_isSorted=false \_isScan=false index-query 1.645 \_indexType=Materialized \_usesCache=false \_statement=SELECT "personId" FROM "DSE_GRAPH_QUICKSTART"."person_p_byName" WHERE "name" = ? LIMIT ?; wit h params (java.lang.String) Julia Child, (java.lang.Integer) 50000 \_options=Options{consistency=Optional[ONE], serialConsistency=Optional.empty, fallbackConsistency=Option al.empty, pagingState=null, pageSize=-1, user=Optional.empty, waitForSchemaAgreement=true, asyn c=true} DsegPropertyLoadStep 1 1 5.274 34.31 >TOTAL - - 15.372 -以下のすべてのクエリーにおいて、何が起こっているのか、あるクエリーが他のクエリーと比較して効率的である理由を調べます。いずれかのクエリーに.profile()を追加すると、上記の情報に似た情報が表示されます。
-
グラフには複数のperson頂点が存在するため、特定のnameを指定して特定の頂点を検索する必要があります。この探索は、Julia Childのnameを持つ(has)頂点に対し、格納されている頂点の情報を取得します。頂点がauthorであるという制約も
has()句に含まれていることに注目してください。クエリーが具体的であるほど、グラフ・クエリーはレイテンシーが小さく、has()ステップは検索範囲を狭める上でツールとして役立ちます。g.V().has('person', 'name', 'Julia Child')Studioでクエリーを実行すると、頂点ID、ラベルならびに全プロパティ値が表示されます。Gremlin Consoleの場合、このクエリーには頂点IDしか表示されません。プロパティ値を得るには、
valueMap()ステップを追加する必要があります。 -
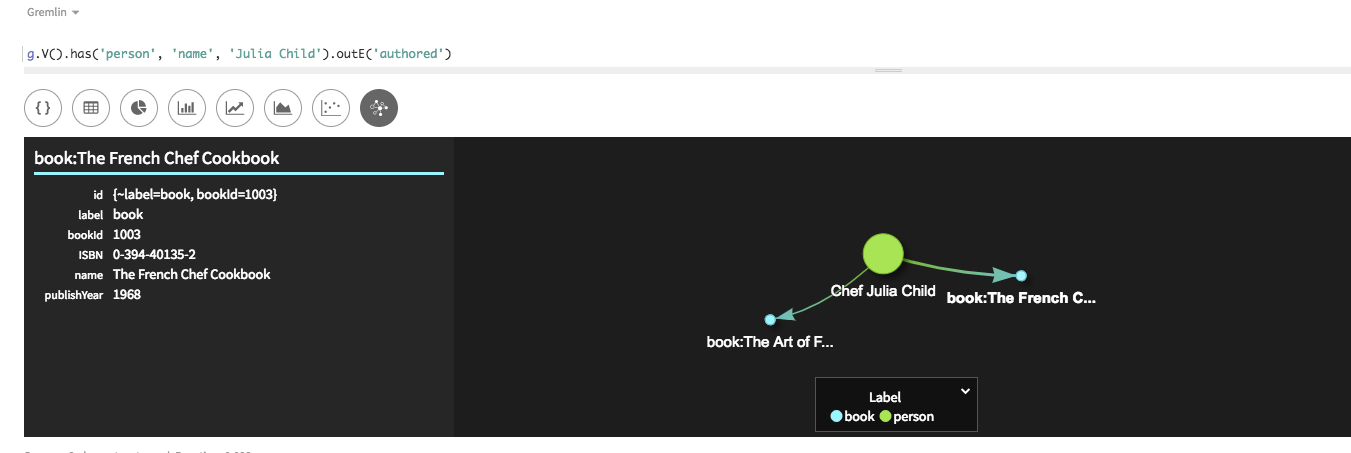
ここで紹介する次の探索では、上記でご覧いただいたように
name = Julia Childによって、has()が頂点プロパティをフィルター処理します。探索ステップoutE()は、authoredラベルを含むその頂点から外向きエッジを検出します。g.V().has('name','Julia Child').outE('authored')Studioでは、[Raw JSON]ビューエッジ情報のリストか、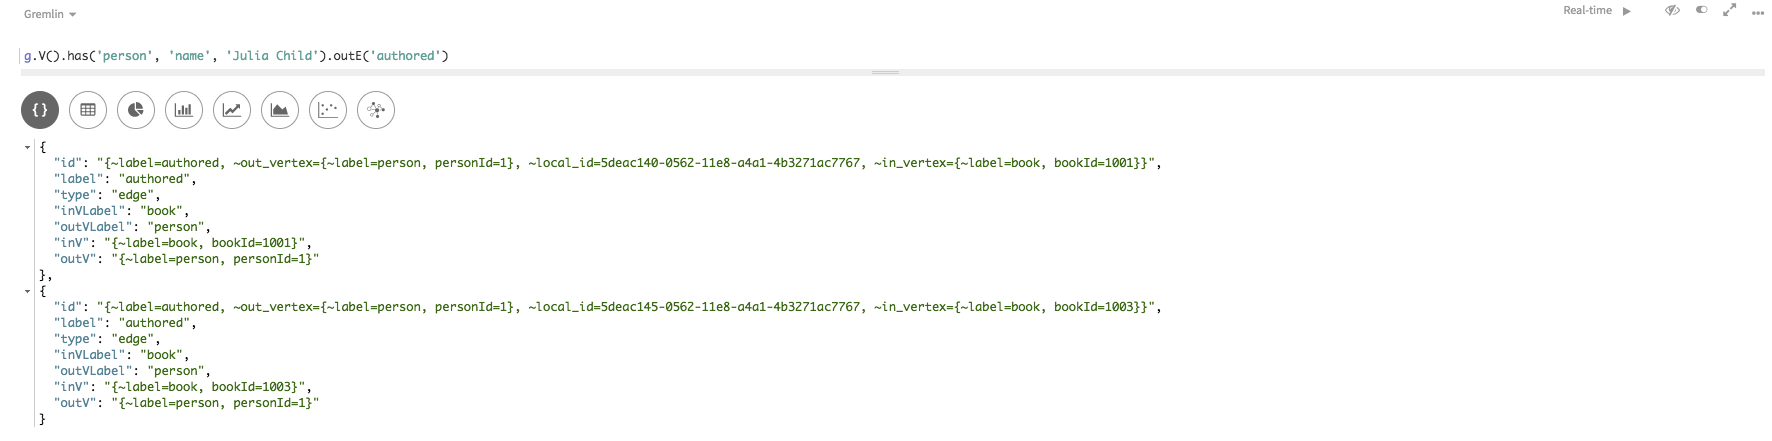
 Gremlin Consoleの場合:
==>e[{~label=authored, ~out_vertex={~label=person, personId=1}, ~in_vertex={~label=book, bookId=1001}, ~local_id=5deac140-0562-11e8-a4a1-4b3271ac7767}][{~label=person, personId=1}-authored->{~label=book, bookId=1001}] ==>e[{~label=authored, ~out_vertex={~label=person, personId=1}, ~in_vertex={~label=book, bookId=1003}, ~local_id=5deac145-0562-11e8-a4a1-4b3271ac7767}][{~label=person, personId=1}-authored->{~label=book, bookId=1003}] -
Spark SQLを使用して、特定の条件に見合った一連の頂点またはエッジに関する情報を探し出すことができます。ここでは、1975年5月1日以降の
createdateを持つエッジはすべて返されます。Spark SQLでは、キャメル・ケース名はありません。SELECT * FROM DSE_GRAPH_QUICKSTART_edges WHERE createdate > '1975-05-01';Studioの場合: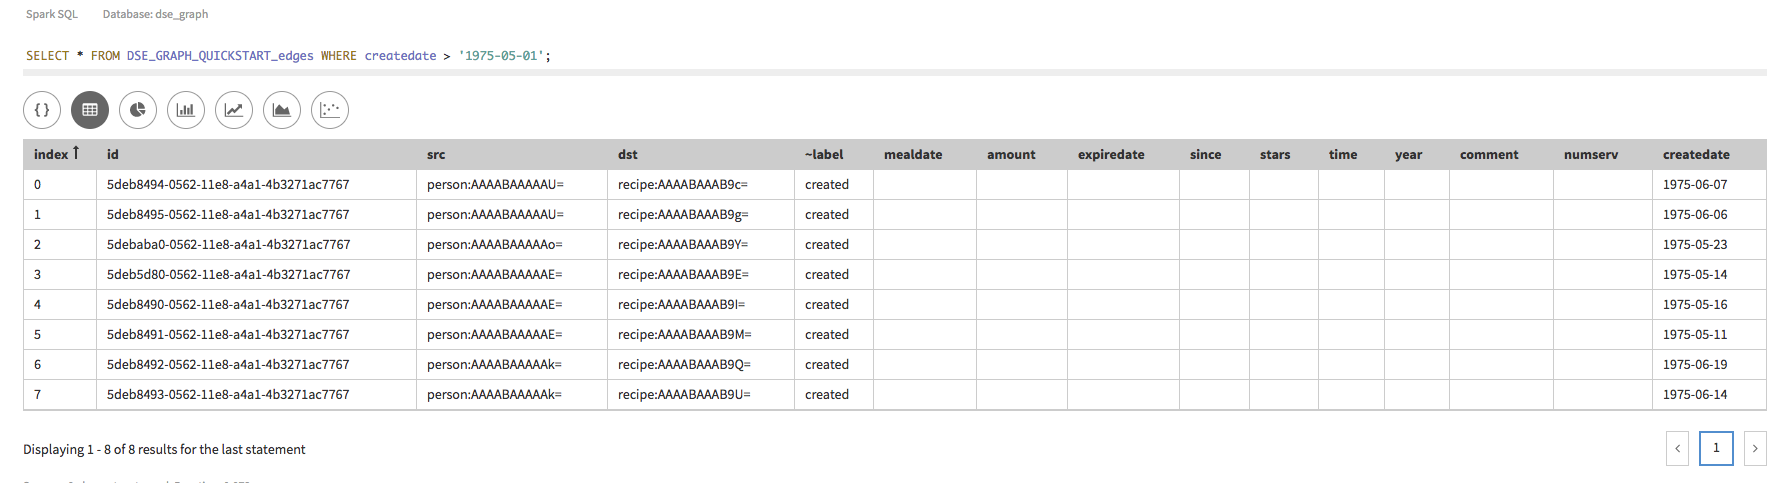
-
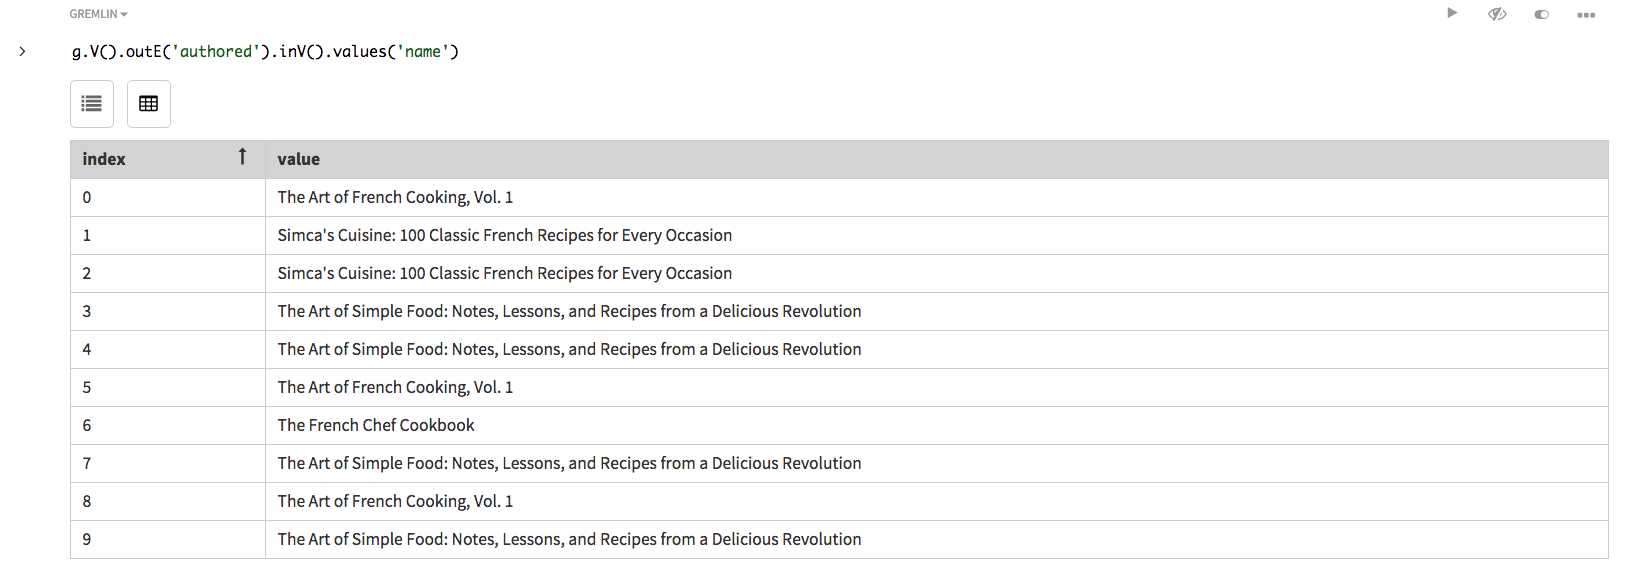
すべての人物が書いた本に対してクエリーを実行する場合は、クエリーを変更する必要があります。前の例ではエッジを取得しましたが、隣接するbook頂点は取得しませんでした。探索ステップ
inV()を追加して、外向きエッジに接続される頂点をすべて検索した後、これらの頂点の本のタイトルを出力します。探索ステップを連結して、V().outE().inV()を使用して頂点から外向きエッジを経由して隣接頂点に移動しているところに注目してください。外向きエッジには特定のフィルター値であるauthoredが与えられます。g.V().outE('authored').inV().values('name')Studioの場合:
 およびGremlin Consoleにおいて似ているリスト。
 -
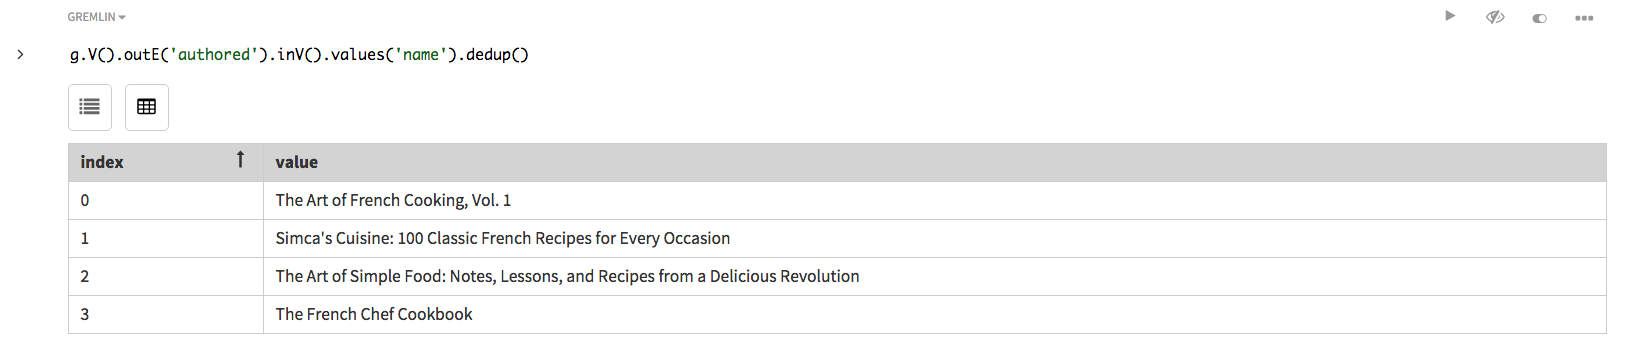
本のタイトルが結果のリスト内で重複していることに注目してください。これは、リスト項目が作者ごとに返されるためです。本に3人の作者が存在する場合は、3つのリスト項目が返されます。この重複は、探索ステップ
dedup()で除去できます。g.V().outE('authored').inV().values('name').dedup()Studioの場合:
 およびGremlin Consoleにおいて似ているリスト。
 -
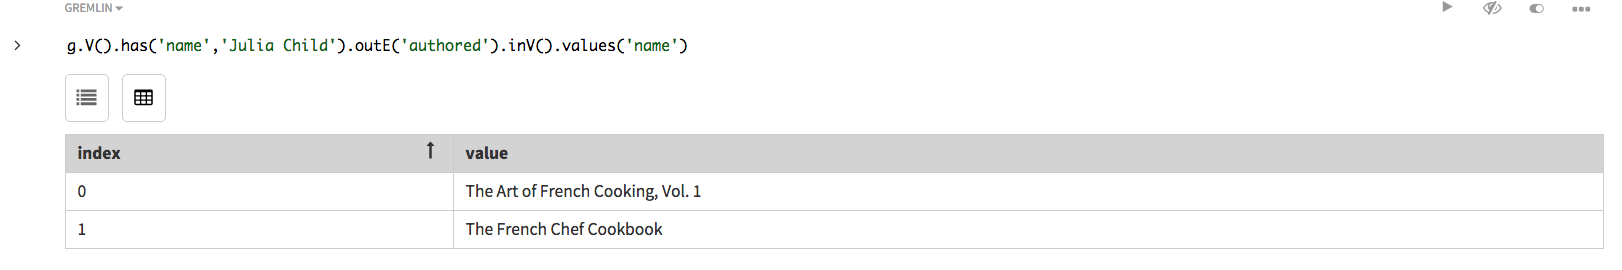
特定の作者に対して
has()ステップを再挿入することで探索を絞り込みます。Julia Childが執筆した本をすべて検索します。g.V().has('name','Julia Child').outE('authored').inV().values('name')Studioの場合:
 およびGremlin Consoleにおいて似ているリスト。
 -
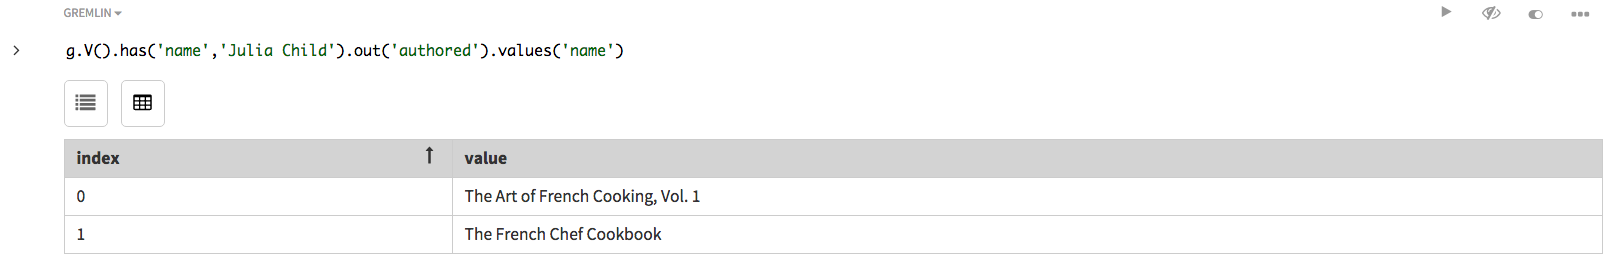
前の例とこの例で返される結果は同じです。ただし、探索ステップの数と探索ステップの種類はパフォーマンスに影響を及ぼします。探索ステップ
outE()は、エッジが明示的に必要な場合にのみ使用してください。この例では、エッジが探索されて、接続されている頂点に関する情報が取得されますが、エッジの情報はクエリーには重要ではありません。g.V().has('name','Julia Child').out('authored').values('name')Studioの場合:
 およびGremlin Consoleにおいて似ているリスト。
探索ステップ
out()は、エッジ・ラベルauthoredに基づいて、エッジ情報を取得せずに、接続されているbook頂点を取得します。大きなグラフ探索では、探索におけるこのわずかな差はレイテンシー問題に発展することがあります。 -
追加の探索ステップで、結果を引き続き微調整します。別の連結された
has探索ステップを追加すると、Julia Childによって書かれ、1967年以降に出版された本のみが検出されます。この例でも、gt、つまりgreater than関数の使用が表示されます。g.V().has('name','Julia Child').out('authored').has('publishYear', gt(1967)).values('name')Studioの場合: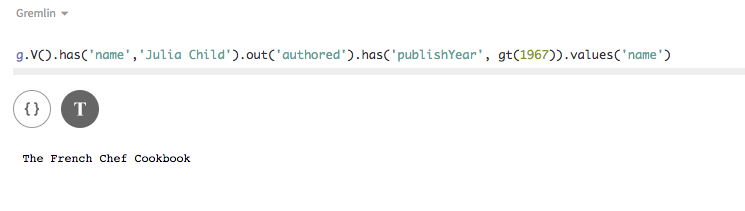
-
開発またはテスト時は、各頂点ラベルを持つ頂点の数をチェックすると、そのデータが読み込まれたことを確認できる場合がよくあります。頂点ラベルごとの頂点の数を検索するには、探索ステップ
label()に続き、探索ステップgroupCount()を使用します。ステップgroupCount()は、前のステップからの結果を集計するのに役立ちます。このクエリーはリアルタイムで実行可能ですが、分析(OLAP)モードで実行する必要があるクエリーの好例と言えます。Studioでは、分析エンジン(Spark)を使用して実行を選択してから実行します。g.V().label().groupCount()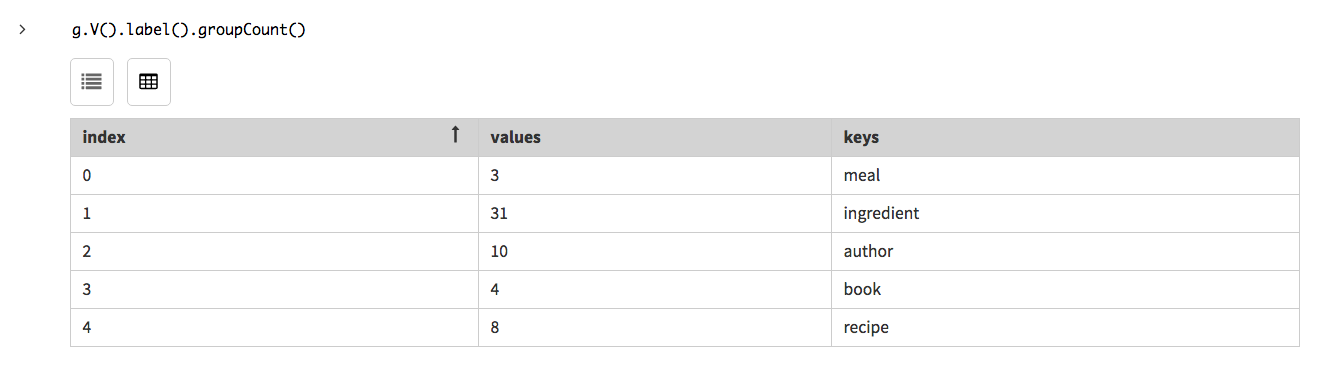
-
Spark SQLを使用してグループ・カウントを得る代替方法は次のとおりです。
SELECT `~label` AS label, COUNT(*) AS label_count FROM DSE_GRAPH_QUICKSTART_vertices GROUP BY label;
QuickStartのデータの書き込みと読み取り。
グラフ・データの書き込みと読み取り。
graph.io()コマンドを利用すると、DSE Graphからファイルへのデータの書き込みをもっとも簡単に達成できます。DSE Graph Loaderは、ファイルや他のソースからのデータを読み込む上で最適なツールです。
手順
-
データを出力ファイルに書き込んで情報を保存または交換します。Gryoファイルは、データをDSE Graphに再読み込みできるバイナリー形式ファイルです。次のコマンドのグラフI/Oは、グラフ全体をファイルに書き込みます。他のファイル形式は、
gryo()をgraphml()またはgraphson()に置き換えることで書き込むことができます。graph.io(gryo()).writeGraph("/tmp/recipe.gryo")注:graph.io()はサンドボックス・モードでは無効です。Studioの場合: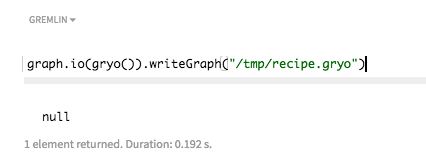 Gremlin Consoleの場合:
==>null
-
Gryoファイルを読み込むには、マッピング用スクリプトを作成した後に、
graphloaderを使用します。graphloader mappingGRYO.groovy -graph recipe -address localhost
Gryoデータの読み込みの詳細は、「DSE Graph Loaderの使用」の「Gryoデータの読み込み」で説明されています。
QuickStartのグラフ・リスト化
グラフのリスト化方法。
手順
-
存在するすべてのグラフを検出するには、システム・コマンドを使用します。
system.graphs() -
Spark SQL内のすべてのテーブルを表示します。
SHOW TABLES FROM DSE_GRAPH_QUICKSTART;
知識を深める
DSE Graphの知識をさらに深めます。
探索のさらなる詳細は、「探索を使用したクエリーの作成」に含まれています。さまざまな読み込みオプションについて調べる必要がある場合は、「DSE Graph Loader」を参照してください。
DataStaxは、DataStax AcademyのDSE Graph self-paced courseもホストしています。無料アカウントを登録して、コースにアクセスします。