Query Trace
The Query Trace pane shows the trace session from the last CQL query executed in the Query Editor tab in tabular form.
DataStax DevCenter is compatible with DataStax Enterprise (DSE) versions up to 5.0.
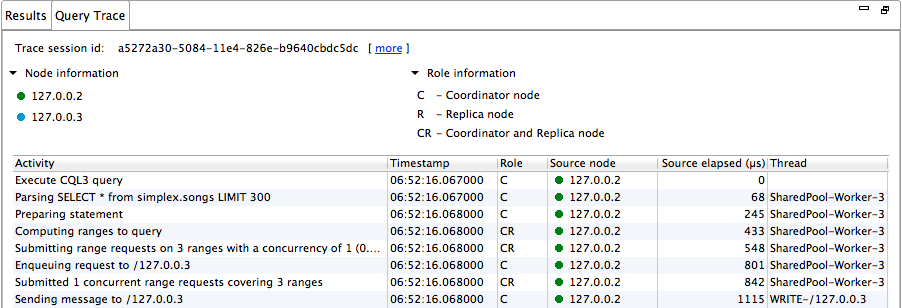
Trace session_id
The Trace session_id uniquely identifies the tracing session. Trace data
is saved for 24 hours and can be queried using statements found by clicking the 'more' link.
For example,
Tracing session information is stored for 24 hours. Session and session event data can be queried with:
SELECT * FROM system_traces.sessions WHERE session_id = d6aa92a0-4f48-11e4-8d9b-65dde8fcb188;
SELECT * FROM system_traces.events WHERE session_id = d6aa92a0-4f48-11e4-8d9b-65dde8fcb188;
Node information
The Node information section lists each node participating in the query along with a color coding for easier identification in the trace table results.
Role information
The Role Information section describes the roles that participating
nodes may play in each trace event:
- C
- Coordinator node
- R
- Replica node
- CR
- Coordinator and Replica node
Trace columns
The columns in the Query trace are:
- Activity
- Description of the activity in the trace event.
- Timestamp
- The timestamp of the event on the source node.
- Role
- The role of the node for this event (Coordinator, Replica, Coordinator and Replica).
- Source node
- The source node where the event occurred.
- Source elapsed (µs)
- Elapsed time of the event on the source node in microseconds.
- Thread
- The name of the thread on the source node that executed the event.
Disabling or enabling Query Trace
Query Trace is enabled in DevCenter by default. Starting in version 1.5, you can disable Query Trace by adding or editing a property to the config.ini file.
devcenter.querytrace.enabled=falseThe location of the config.ini file is in the DevCenter_Home/configuration directory.