Monitoring a Cassandra cluster
Understanding the performance characteristics of a Cassandra cluster is critical to diagnosing issues and planning capacity.
Understanding the performance characteristics of your Cassandra cluster is critical to diagnosing issues and planning capacity.
Cassandra exposes a number of statistics and management operations via Java Management Extensions (JMX). Java Management Extensions (JMX) is a Java technology that supplies tools for managing and monitoring Java applications and services. Any statistic or operation that a Java application has exposed as an MBean can then be monitored or manipulated using JMX.
During normal operation, Cassandra outputs information and statistics that you can monitor using JMX-compliant tools, such as:
- The Cassandra nodetool utility
- DataStax OpsCenter management console
- JConsole
Using the same tools, you can perform certain administrative commands and operations such as flushing caches or doing a node repair.
Monitoring using nodetool utility
The nodetool utility is a command-line interface for monitoring Cassandra and performing routine database operations. Included in the Cassandra distribution, nodetool and is typically run directly from an operational Cassandra node.
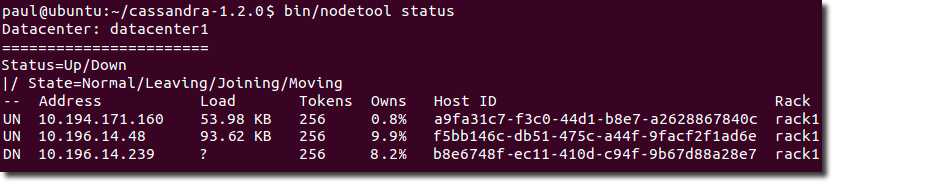
The nodetool utility supports the most important JMX metrics and operations, and includes other useful commands for Cassandra administration. This utility is commonly used to output a quick summary of the ring and its current state of general health with the status command. For example:
- nodetool cfstats displays statistics for each table and keyspace.
- nodetool cfhistograms provides statistics about a table, including read/write latency, row size, column count, and number of SSTables.
- nodetool netstats provides statistics about network operations and connections.
- nodetool tpstats provides statistics about the number of active, pending, and completed tasks for each stage of Cassandra operations by thread pool.
DataStax OpsCenter
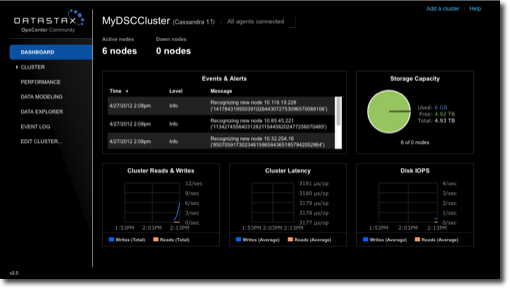
DataStax OpsCenter is a graphical user interface for monitoring and administering all nodes in a Cassandra cluster from one centralized console. DataStax OpsCenter is bundled with DataStax support offerings. You can register for a free version for development or non-production use.
OpsCenter provides a graphical representation of performance trends in a summary view that is hard to obtain with other monitoring tools. The GUI provides views for different time periods as well as the capability to drill down on single data points. Both real-time and historical performance data for a Cassandra or DataStax Enterprise cluster are available in OpsCenter. OpsCenter metrics are captured and stored within Cassandra.
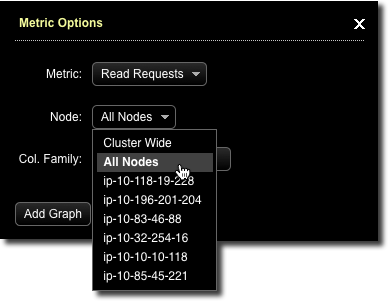
Within OpsCenter you can customize the performance metrics viewed to meet your monitoring needs. Administrators can also perform routine node administration tasks from OpsCenter. Metrics within OpsCenter are divided into three general categories: table metrics, cluster metrics, and OS metrics. For many of the available metrics, you can view aggregated cluster-wide information or view information on a per-node basis.
Monitoring using JConsole
- Overview
Displays overview information about the Java VM and monitored values.
- Memory
Displays information about memory use.
- Threads
Displays information about thread use.
- Classes
Displays information about class loading.
- VM Summary
Displays information about the Java Virtual Machine (VM).
- Mbeans
Displays information about MBeans.
The Overview and Memory tabs contain information that is very useful for Cassandra developers. The Memory tab allows you to compare heap and non-heap memory usage, and provides a control to immediately perform Java garbage collection.
- org.apache.cassandra.db
Includes caching, table metrics, and compaction.
- org.apache.cassandra.internal
Internal server operations such as gossip and hinted handoff.
- org.apache.cassandra.net
Inter-node communication including FailureDetector, MessagingService and StreamingService.
- org.apache.cassandra.request
Tasks related to read, write, and replication operations.
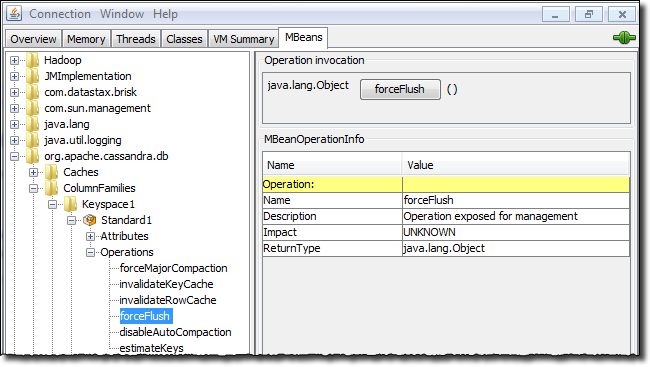
When you select an MBean in the tree, its MBeanInfo and MBean Descriptor are displayed on the right, and any attributes, operations or notifications appear in the tree below it. For example, selecting and expanding the org.apache.cassandra.db MBean to view available actions for a table results in a display like the following:
If you choose to monitor Cassandra using JConsole, keep in mind that JConsole consumes a significant amount of system resources. For this reason, DataStax recommends running JConsole on a remote machine rather than on the same host as a Cassandra node.
The JConsole CompactionManagerMBean exposes compaction metrics that can indicate when you need to add capacity to your cluster.