Spark user interface
A Spark web interface is bundled with DataStax Enterprise. The Spark web interface facilitates monitoring, debugging, and managing Spark and Shark.
A web interface, bundled with DataStax Enterprise, facilitates monitoring, debugging, and managing Spark and Shark.
dse -u username -p password, the credentials are present
in the logs of Spark workers when the driver is run in cluster mode. The Spark Master,
Worker, Executor, and Driver logs might include sensitive information. Sensitive information
includes passwords and digest authentication tokens for Kerberos
authentication mode that are passed in the command line or Spark configuration.
DataStax recommends using only safe communication channels like VPN and SSH to access the
Spark user interface.To use the Spark web interface, enter the public IP address of the master node in a browser
followed by port number 7080. You can change the port by modifying the spark-env.sh configuration file.
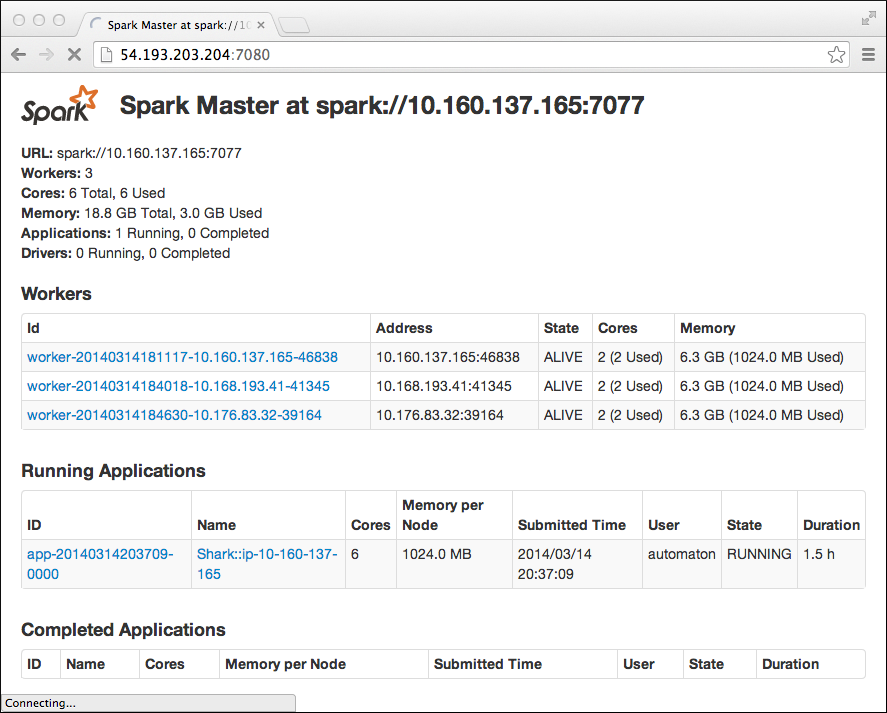
The Workers section lists three registered nodes. The misleading summary information in the top left corner of the page covers alive and dead workers.
Spark Worker page
In the Spark master node page, click the ID of a worker node, in this example worker-20140314184018-10.168.193.41-41345. The Spark Worker page for the node appears. In this web interface, you see detailed information about apps that are running. For example, while running Shark queries in the earlier example, the Spark Worker shows details about the Shark job.
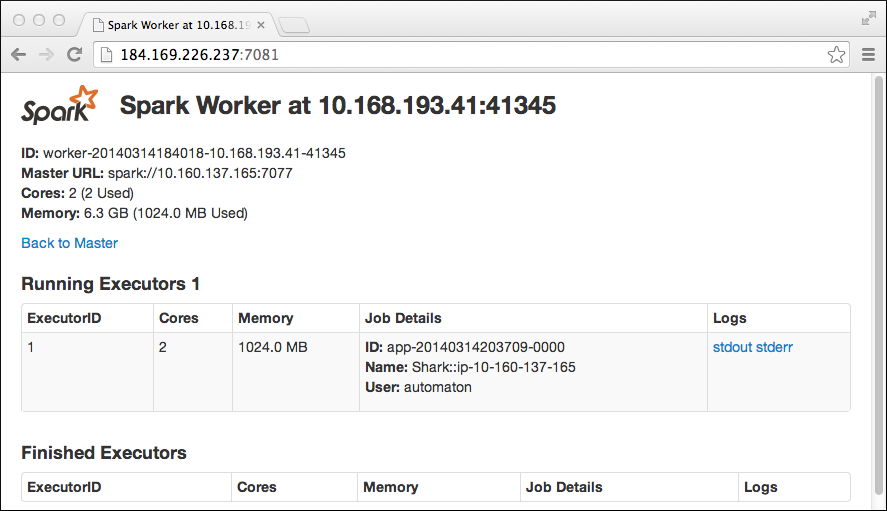
To get debugging information, click the stdout or stderr links in the Logs column.
After starting a Spark context, you can see the status of the worker, which can be useful for debugging. The interface also shows the memory required for apps that are running, so you can adjust which apps you run to meet your needs.
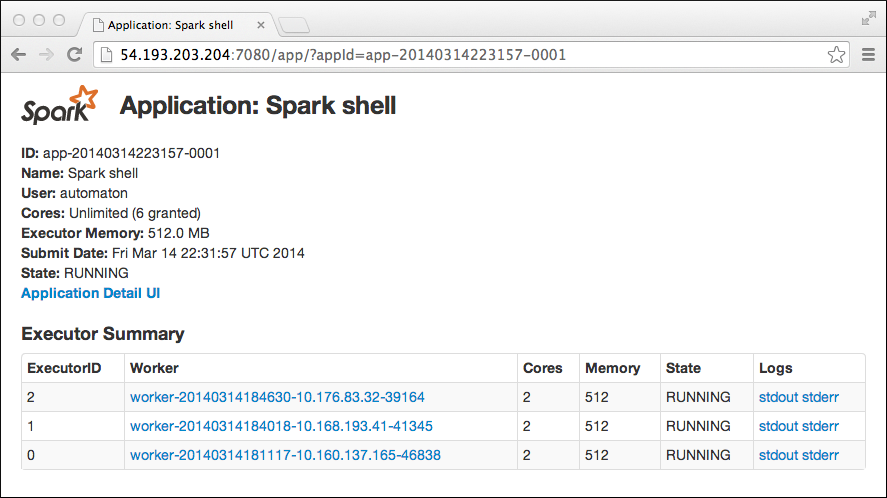
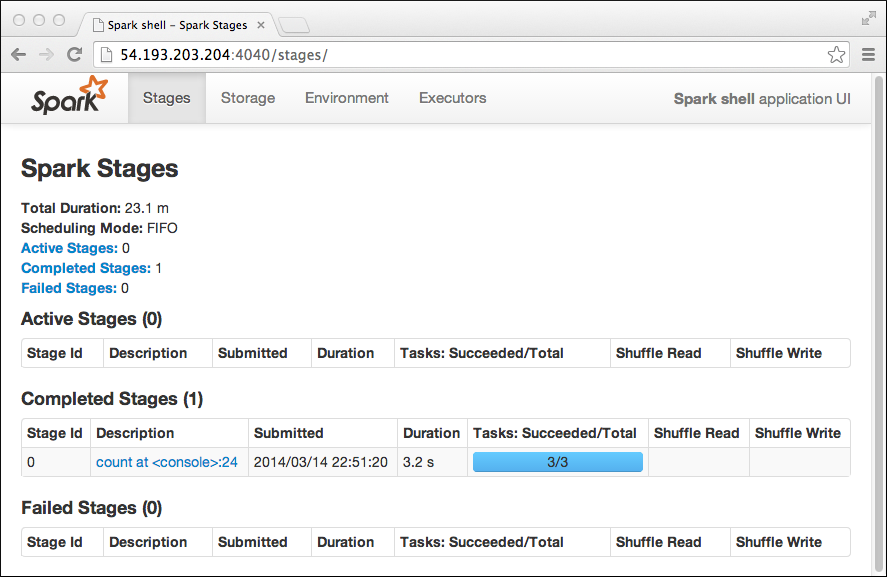
You can also see the progress of applications that are running. Click the name of application to see every query that was executed. You can see detailed information about how the data got distributed that might be valuable for debugging. On a port, not necessarily port 4040 shown here, you can view Spark stages. When you run multiple applications at the same time Spark tries to use subsequent ports starting at 4040, for example 4040, 4041, and so on.