Running the Weather Sensor demo
The Weather Sensor demo compares how long it takes to run Hive versus Shark queries against aggregated data for a number of weather sensors in various cities.
Using the Weather Sensor demo, you can compare how long it takes to run Hive versus Shark queries against aggregated data for a number of weather sensors in various cities. For example, you can view reports using different metrics, such as temperature or humidity, and get a daily rollup.
You run customize Shark or Hive queries using different metrics and different dates. In addition to querying CQL tables, you time Shark and Hive queries against data in the Cassandra File System (CFS).
Prerequisites
Before running the demo, install the following source code and tools if you do not already have them:
- Python 2.7
- Debian and Ubuntu
$ sudo apt-get install python2.7-dev - RedHat or CentOS
$ sudo yum install python27 - Mac OSX already has Python installed.
- Debian and Ubuntu
- pip installer tool
- Debian and
Ubuntu
$ sudo apt-get install python-pip - RedHat or CentOS
$ sudo yum install python-pip - Mac OS X
$ sudo easy_install pip
- Debian and
Ubuntu
export PATH=$PATH:~/install_location/bin/Start DataStax Enterprise and import data
You start DataStax Enterprise in Spark and Hadoop mode, and then run a script that creates the schema for weather sensor data model. The script also imports aggregated data from CSV files into Cassandra CQL tables. The script uses a hadoop fs command to put the CSV files into the Cassandra File System.- Start DataStax Enterprise in Hadoop and Spark mode.
- Run the create-and-load CQL script in the weather_sensors/resources directory. On Linux,
for example:
$ cd install_location/demos/weather_sensors
$ bin/create-and-load
The output confirms that the script imported the data into CQL and copied files to CFS.. . . 10 rows imported in 0.019 seconds. 2590 rows imported in 2.211 seconds. 76790 rows imported in 33.522 seconds. + echo 'Copy csv files to Hadoop...' Copy csv files to Hadoop... + dse hadoop fs -mkdir /datastax/demos/weather_sensors/
Starting Shark and Hive
You start the Shark and Hive services on specific ports to avoid conflicts. Start these services using your local user account. For example, do not use sudo.
- Start the Shark service on port 5588. On Linux, for example:
$ cd install_location $ bin/dse shark --service sharkserver -p 5588 - Open a new terminal and start the Hive service in DSE on port 5587.
$ bin/dse hive --service hiveserver -p 5587If you see a message saying, "The blist library is not available, so a pure python list-based set will," just ignore it.
Start the web app and query the data
- Open another terminal and start the Python service that controls the web interface:
$ cd install_location/demos/weather_sensors $ python web/weather.py - Open a browser and go to the following URL:
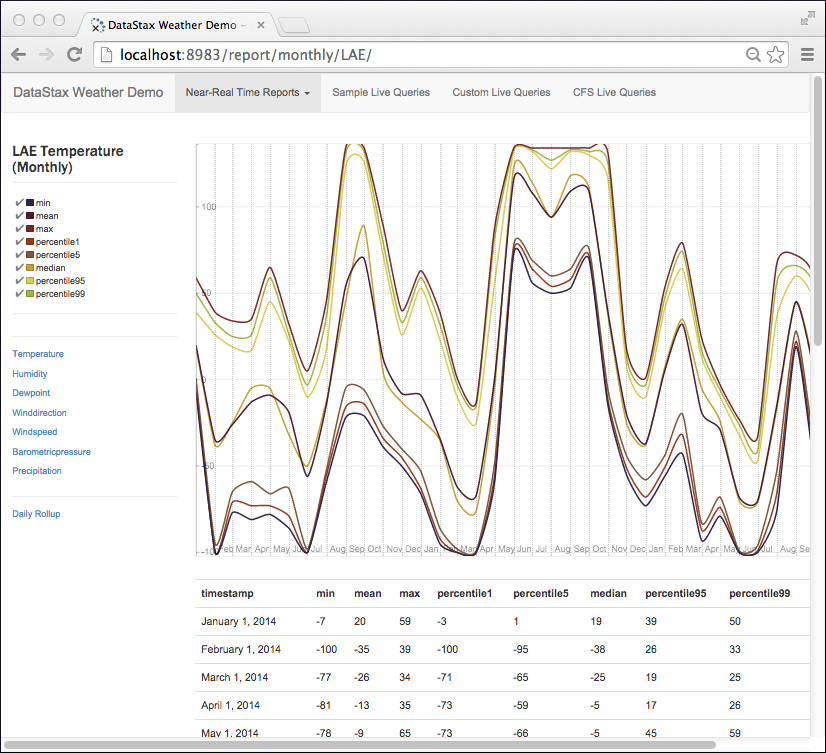
http://localhost:8983/The weather sensors app appears. Select Near Real-Time Reports on the horizontal menu. A drop-down listing weather stations appears:

- Select a weather station from the drop-down, view the graph, and select different metrics from the vertical menu on the left side of the page.
- On the horizontal menu, click Sample Live Queries, then select a sample script. Click
the Shark button, then click Submit.
The time spent loading results using Spark appears.

- Click the Hive button to see the time spent loading results in Hive.

- From the horizontal menu, click Custom Live Queries. Click a Week Day, and then a metric, such as Wind Direction. Click Recalculate Query. The query reflects the selections you made.
- From the horizontal menu, click CFS Live Queries. Click Shark. The time spent loading
results from CFS using Shark appears.

Clean up
To remove all generated data, run the following commands:
$ cd install_location/demos/weather_sensors
$ bin/cleanup$ echo "DROP KEYSPACE weathercql;" | cqlsh