General System/OS checks for DSE/Cassandra clusters
While it is possible to perform listed checks on individual nodes of the cluster, it may not be effective for multiple servers. In the latter case, it is easier to use diagnostic collection scripts that collect a lot of information that this document lists.
|
Cassandra, beginning with version 3.0, and DSE with Cassandra, beginning with version 5.0, perform some of the following checks on every system start. |
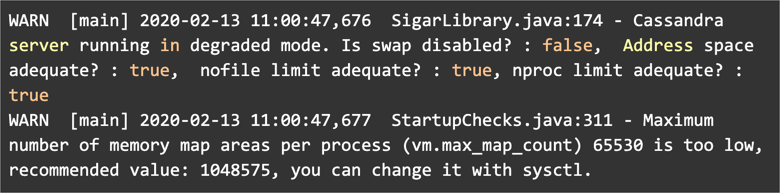
You can identify any misconfiguration by looking in the logs for lines similar to the following:
Infrastructure checks
Check network
-
Check network-related errors. For example,
ifconfigshows a number of packets with errors, and more. If you see a significant number (several percent of the total packets), for RX and TX rows:-
errors - total number of packets received with errors (CRC, overruns, and so on). This could indicate symptoms for malfunctioning network hardware, either server or elsewhere in the network.
-
overruns - number of received packets that experienced FIFO overruns, which is caused by the rate at which a buffer gets full and the kernel is unable to empty. You may need to tune the
TCPparameters of the Linux kernel, as described in [Check OS Messages]. -
carrier (only for TX) - number of packets that have experienced loss of carriers. This could be a symptom for a flapping link.
-
-
Check network latency and throughput between nodes, and between client and cluster. You can do this with a
ping(simple case),iperf,mtr,iftop, or other tools. Inside the datacenter network, latency should not be more than 1ms (millisecond). -
Check connectivity between Cassandra/DSE nodes (DSE 6.8 | 6.0 | 5.1), OpsCenter (6.8 | 6.5 | 6.1) and clients on specific ports used for communication to make sure that firewall does not block communication. Use nc -zv host port to check if connections exist to specific ports.
-
Check that the Linux kernel is configured with optimal parameters (DSE 6.8 | 5.1) for networking.
Check disks
-
Check that SAN/NAS are not used for Cassandra data.
-
Check for disks type - spinning vs. SSD (for example,
smartctl). -
Check that no errors are reported by
S.M.A.R.T.(Examples are usingsmartmontoolsor errors visible in the system logs). -
Check if
RAIDis used. Do not useRAID-5,RAID-6, or their variants, such asRAID-50orRAID-60, each of which has worse performance characteristics. Cassandra natively supportJBODconfigurations, althoughRAID-0,RAID-1, orRAID-10can be used as well. -
Check disk latencies using tools like
iostat(or better,iostat-cli). Look for%iowait,avgrq-sz,avgqu-sz,await,r_await, andw_await.-
awaitshows the average time in ms spent by an I/O request computed from its very beginning to its end. High numbers (> 5ms) show that I/O system can’t cope with the required throughput. -
r_awaitandw_awaitboth show where the bottleneck is in read/write operations. -
avgqu-szshows average queue length of the requests issued to the given disk device. For SSD disks it should be smaller than 10. It could be higher for HDDs.
-
-
When using rotational disks, check that you are using separate disks for Cassandra data and commit logs. Be sure to separate them from the system disks.
-
Check that DSE Search data is placed on a separate disk (even on SSD).
-
Check that the disk settings for the Host OS (
readahead/scheduler…) are set correctly, as defined for DSE 6.8 | 5.1.By reducing the
readaheadsetting, you can improve Cassandra performance.These settings are different for SSDs and spinning disks.
-
For Cassandra, use a file system format that provides good performance, such as
ext4orxfs. These file systems provide support for big files and journaling, and perform better than other file systems such asext2andext3.
Check CPUs
-
Use
lscpuor check/proc/cpuinfoto determine the CPU model, number of cores, frequency, and other information. -
Check that the CPU scaling governor for DSE (6.8 | 5.1) is set to performance and
NUMA zone_reclaim_modeis disabled. -
On the systems with multiple physical CPUs, check with
lstopoornumactlto ensure that all PCI components are inNUMAmode. -
Check
/proc/interruptsfor interrupts between the different CPUs, and that interrupts are not assigned to the same CPU. This can lead to overloading of a specific CPU. If necessary, tune the SMP affinity for specific interrupt requests. -
Check CPU stats reported by
iostat,vmstat, and so on. A lot of steal time or CPU-ready time suggests that your virtual machine is either over-allocated or that you have noisy neighbors (other services that are running on the same server as your virtual machine), or both.
Operating system-level checks
For DSE, check that you are using a supported operating system. It is very important to ensure that compatible components are used.
|
For Cassandra, no official list of supported platforms exists, but the requirements for DSE are the same as for Cassandra. You can use these settings as a base. |
System configuration checks
-
Make sure that Hugepage defragmentation (DSE 6.8 |https://docs.datastax.com/en/dse/5.1/dse-dev/datastax_enterprise/config/configRecommendedSettings.html#CheckJavaHugepagessettings[5.1]) is disabled. If Hugepage defragmentation is enabled, it can lead to unexpected pauses in garbage collection.
-
Set system clocks to
TSCwhen it is available: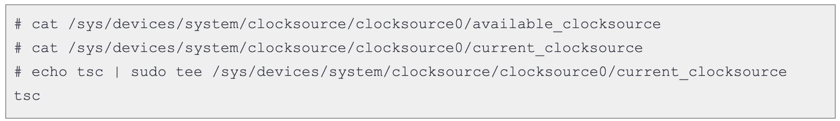
-
Check that system clocks (DSE 6.8 | 5.1) are synchronized on all nodes in the Cassandra cluster and on all clients that use Cassandra.
-
Ensure that resource limits (DSE 6.8 | 5.1), such as the maximum number of open files, maximum number of processes, and memory lock limit are configured correctly in
/etc/security/limits.confor a related file:-
Allow at least
100,000`open files (the `nofileparameter). -
Allow at least
32,000processes (thenprocparameter). -
Set the address space (as parameter) and maximum locked-in-memory address space (the
memlockparameter) to unlimited.
-
-
Set the maximum number of memory map areas per process (
vm.max_map_countparameter in/etc/sysctl.conf) to1048575or a higher value. -
Use newer versions of the Linux kernel. Kernels starting with version 3.13 have enhanced SSD support and provide better overall performance.
Make sure that the settings are persistent after a reboot. For example:
-
Linux kernel parameters are specified in
/etc/sysctl.conffile and automatically loaded from this file on reboot -
swap is disabled via
/etc/fstab -
resource limits are configured via
/etc/security/limits.conf
Check OS messages
Search system messages for any entries about out-of-memory (OOM) killer activity, segfaults, disk problems, network issues (typically, TCP SYNC flood), and so on. Execute the following command to get system messages. The -T flag enforces a human-readable timestamp.
dmsg -T
Then search for following lines:
-
For OOM killer:
Out of memory: Killed process NNN …, and check if it was caused by a Cassandra/DSE process. -
When process
segfaults, which is shown asname[proc_id]: segfault at …, check if it was caused by a Cassandra or DSE process. -
For
TCP SYNC flood(TCP: Possible SYN flooding on port NNN, especially if the given port belongs to Cassandra or DSE), follow the instructions specific for your Linux distribution to solve the problem. For example, see RedHat). -
For disk problems, search for strings containing
disk_id: failed command…ordisk_id: exception…, wheredisk_idcould beata7.00or similar, depending on the disk type.
Permissions of the /tmp folder
The /tmp folder must be executable as it is used for extraction and loading of the native code. If the /tmp folder is not executable, then add the following two statements to the jvm.options file:
-
-Dio.netty.native.workdir=<path> -
-Djna.tmpdir=<path>
