Important Metrics and Alerts
Monitoring OSS Apache Cassandra® clusters is a very important activity that allows you to identify problems in your clusters and react faster to mitigate them.
OSS Cassandra exposes metrics for observation and analysis. Cassandra uses Java Management Extensions (JMX), which is a technology within Java that provides tools for managing and monitoring applications, to do the following:
-
Expose metrics
-
Make temporary configuration changes, such as changing the compaction throughput
-
Run operations, such as compaction.
JMX is also used by nodetool and other Cassandra tools.
There are approximately 40 metrics per keyspace, 60 to 70 metrics per individual table, and even more metrics for different subsystems. The remainder of this topic provides guidance for understanding the most important metrics. For more information about the exposed metrics, see the Cassandra documentation. This guide focuses on the metrics that are typically considered the most valuable.
Observability tools
You can use the following tools for collection and analysis of metrics:
-
Tools for one-off analysis with JMX, including JConsole,
jmxterm, andnodetool sjk. -
DSE OpsCenter collects metrics using JMX, stores them in DSE, and uses them for visualization and alerts. Metrics collection requires that the DataStax Agent is running on your DSE nodes.
-
DSE Metrics Collector collects metrics from DSE and other entities, such as CPU and disks, using collectd.
The DSE Metrics Collector also enables integration with different monitoring systems using
collectdplugins. For example, you can expose data to Prometheus with visualization via Grafana using predefined dashboards. Because metrics are exposed directly, you do not need the DataStax Agent running on your nodes. -
The Metrics Collector for Apache Cassandra together with Prometheus and Grafana (also with predefined dashboards), provides the same functionality as DSE Metrics Collector for open-source Cassandra clusters.
-
External tools for integration with monitoring systems like Prometheus (via JMX Exporter for Prometheus) and other monitoring tools may require additional tuning and dashboard creation.
What do you need to monitor?
The important metrics that require monitoring can split into several groups:
- Metrics related to client request
-
How the system performs from the point of view of the client application.
-
Coordinator level latency for read and write operations, especially for 95/99th percentiles.
-
Number of client connections.
-
- Metrics related to threadpools that process data and execute different tasks
-
Examples include compaction, and flushing of data.
-
How many threads are in the blocked state. For example, memtable flush writer, memtable pool allocations, and so on.
-
How many threads are in the aborted state, like aborted compactions.
-
How many threads are in the pending state, such as pending compactions and pending flushes.
-
- Metrics related to Thread-per-Core (TPC)
-
Applies to DSE 6.0 and later only.
- Metrics related to individual tables
-
It is useful to track such metrics for your most important tables to make sure that SLAs are met and avoid problems.
-
Partition size.
-
Number of SSTables overall.
-
Number of SSTables read per request.
-
Number of tombstones scanned during read request.
-
Coordinator-level read and write latencies.
-
- Metrics related to inter-cluster communication
-
These metrics provide information on how data exchange happens in the cluster: replication, hinted handoff, and so on:
-
Number of dropped mutations, and other messages.
-
Total number of timeouts and timeouts per host.
-
Cross-datacenter latency.
-
Number of hints on disk.
-
Hint replay (number of failed and timed out hint messages).
-
- Metrics related to the Java Virtual Machine (JVM)
-
-
Amount of memory used.
-
Duration of garbage collection pauses.
-
- Metrics related to operating system and hardware
-
-
CPU usage on the node.
-
Amount of disk space available.
-
Important metrics exposed via JMX
The following list of metrics are recommended by DataStax for monitoring and generating alerts that cross their threshold setting.
These are general recommendations. You might need to increase or decrease the target values depending on your workloads.
- Read and write latencies at the coordinator level
-
Total and per keyspace/table.
JMX in MBean
org.apache.cassandra.metrics:type=ClientRequest,scope=Write,name=Latency ClientRequest,scope=Read,name=Latency type=Table,keyspace=ks,scope=*,name=ReadLatency type=Table,keyspace=ks,scope=*,name=WriteLatencyAlerting condition:
99ptgreater than200msfor more than 1 minute - Overall internode latency
-
JMX in MBean
org.apache.cassandra.metrics:type=Messaging,name=CrossNodeLatency - Internode latency for datacenter with name DC-Name
-
JMX in MBean
org.apache.cassandra.metrics:type=Messaging,name=<DC-Name>-Latency - Number of pending compaction tasks
-
Total per node, and/or for tables in specific keyspace.
JMX in MBean
org.apache.cassandra.metrics:type=Compaction,name=PendingTasks type=Table,keyspace=ks,scope=*,name=PendingCompactionsAlerting condition: more than
30for more than15minutes. - Number of dropped mutations
-
Total and/or per table in given keyspace.
JMX in MBean
org.apache.cassandra.metrics:type=Table,name=DroppedMutations type=Table,keyspace=ks,scope=*,name=DroppedMutationsAlerting condition: Non-zero value.
- Number of timeouts occurring on a specific node
-
JMX in MBean
org.apache.cassandra.metrics:type=MessagingService,name=TotalTimeouts type=MessagingService,name=TimeoutsPerHostAlerting condition: Heavy number increase during the last
5to15minutes.Required reaction: Possible sign of network problems and similar problems.
- Maximum partition size in bytes
-
JMX in MBean
org.apache.cassandra.metrics:Table,name=MaxPartitionSize type=Table,keyspace=ks,scope=*,name=MaxPartitionSizeAlerting condition: Partitions greater than
100 Mb.Required reaction: Alert development team, as this indicates problems with the data model.
- Total number of SSTables in system and per table
-
JMX in MBean
org.apache.cassandra.metrics:type=Table,name=LiveSSTableCount type=Table,keyspace=ks,scope=*,name=LiveSSTableCountAlerting condition: More than
200per individual table (depends on the used compaction strategy).Required reaction: Too many big tables, which leads to performance degradation.
- Number of hints stored on individual node
-
JMX in MBean
org.apache.cassandra.metrics:type=Storage,name=TotalHintsAlerting condition: Value greater than zero indicates that some nodes are not reachable.
- Hint Replay Success/Failure/Timeout Rate
-
JMX in MBean
org.apache.cassandra.metrics:type=HintsService,name=HintsSucceeded type=HintsService,name=HintsFailed type=HintsService,name=HintsTimedOut - Number threads are blocked by memtable allocation
-
JMX in MBean
org.apache.cassandra.metrics:type=MemtablePool,name=BlockedOnAllocationAlerting condition: Non-zero value
- Number of blocked memtable flush writer tasks
-
This condition can lead to heavy write performance degradation.
JMX in MBean
org.apache.cassandra.metrics:type=ThreadPools,path=internal,scope=MemtableFlushWriter,name=CurrentlyBlockedTasksAlerting condition: Non-zero value.
Required reaction: Investigate. This condition has many causes, including failing disks and excessive disk operations.
- Number of blocked compaction tasks
-
JMX in MBean
org.apache.cassandra.metrics:type=ThreadPools,path=internal,scope=CompactionExecutor,name=CurrentlyBlockedTasksAlerting condition: Non-zero value.
- Number of aborted compaction tasks
-
JMX in MBean
org.apache.cassandra.metrics:name=CompactionsAborted,type=CompactionAlerting condition: Non-zero value.
- Information about Java’s garbage collection
-
Caused by Mac GC Elapsed and similar.
JMX in MBean
org.apache.cassandra.metrics:type=GCInspector - Number of segments waiting on commit
-
JMX in MBean
org.apache.cassandra.metrics:type=CommitLog,name=WaitingOnCommit,name=CountAlerting condition: High count during last minute.
- 99th percentile of time spent waiting on commit
-
JMX in MBean
org.apache.cassandra.metrics:type=CommitLog,name=WaitingOnCommit,name=99thPercentile - Number of pending flushes
-
JMX in MBean
org.apache.cassandra.metrics:type=Table,name=PendingFlushes - Hit ratio for key cache
-
Only Cassandra and DSE prior to version 6.0.
JMX in MBean
org.apache.cassandra.metrics:type=Cache,scope=KeyCache,name=HitRateAlerting condition: Hit ratio is lower than
0.9.Required reaction: If the cache is full (capacity is equal to size), increase the size of the key cache.
Visualize important metrics in DSE OpsCenter
DSE OpsCenter collects metrics from all nodes in a cluster and stores original data, together with rollups in the DSE cluster. This data is then used to create graphs and alerts. When using DSE OpsCenter for monitoring, the following list of both the metrics and the graphs is useful for setting up an effective monitoring of the cluster:
-
Active Alerts
-
Cluster Health
-
Storage Capacity
-
Read and Write Request Latency
-
Read and Write Requests
-
Data Size
-
Compactions Pending
-
Dropped Messages: Mutations
-
Dropped Messages: Reads
-
Native Clients
-
For specific tables (setup for most important tables):
-
TBL: SSTables per read (percentiles)
-
TBL: Tombstones per read (percentiles)
-
TBL: Partition size (percentiles)
-
-
Related to hinted handoff:
-
Hints on Disk
-
TP: Hint Dispatcher Active
-
TP: Hint Dispatcher Completed
-
Dropped Messages: Hinted Handoff
-
-
Related to operating system:
-
OS: Disk Latency
-
OS: Load
-
OS: CPU Iowait
-
OS: Memory Free
-
-
Related to Java Virtual machine:
-
Heap Used
-
JVM G1 Old Collection Count and Time
-
JVM G1 Young Collection Count and Time
-
-
When DSE Search is enabled:
-
Search: Core Size
-
Search: Read Latency
-
Search: Timeouts
-
-
When NodeSync is enabled, NodeSync related:
-
TP: Read Range NodeSync Active
-
NodeSync: Uncompleted Pages, Failed Pages
-
Alerts in DSE OpsCenter
DSE OpsCenter alerts the operator when certain conditions are met. Examples include when a node is down and latency is too high for a long period of time. Email, SNMP, and HTTP requests are ways DSE OpsCenter can deliver alerts.
Configure the following alerts to operatively react to problems in DSE clusters.
- Node Down
-
When a node is marked as down by DSE OpsCenter.
Condition: "<event>" for more than
X<minutes|hours|days>Recommendation:
X:immediatelyor1 minute(depending on whether some level of tolerance of the event is possible)Criticality/Notification frequency: Urgent
- Agent Issue
-
When a monitored DataStax Agent experiences issues.
Condition: "<event>" for more than
X<minutes|hours|days>Recommendation:
X:30 minutesCriticality/Notification frequency: Low
- CPU Usage
-
The percentage of CPU was busy.
Condition: "<event>" is above
Xfor more thanY<minutes|hours|days>Recommendation:
X:100,Y:1 hourCriticality/Notification frequency: Low
- Load
-
The overall amount of work that a computer system performs.
Condition: "<event>" is above
Xfor more thanY<minutes|hours|days>Recommendation:
X:0.7x total number of CPU cores,Y:1 hourCriticality/Notification frequency: High
- Write Request Latency (percentiles)
-
The response time (in milliseconds) for successful write operations.
Condition: "<event>" is above
Xms/op for more thanY<minutes|hours|days> for selectedZpercentileRecommendation:
X: <depending on application SLA>,Y:4 hours,Z:99Criticality/Notification frequency: Medium
- Read Request Latency (percentiles)
-
The response time (in milliseconds) for successful read operations.
Condition: "<event>" is above
Xms/op for more thanY<minutes|hours|days> for selectedZpercentileRecommendation:
X: <depending on application SLA>,Y:4 hours,Z:99Criticality/Notification frequency: Medium
- Advanced → System → Disk Usage(%)
-
The percentage of disk being used for a particular disk partition.
Condition: "<event>" is above
X% for more thanY<minutes|hours|days>Recommendation:
X:50,Y:4 hoursCriticality/Notification frequency: Medium
- Advanced → Tables → TBL: SSTables per Read (percentiles)
-
For a specified percentile, how many SSTables are accessed during a read.
Condition: "<event>" is above X SSTables for more than
Y<minutes|hours|days> forWtable atZpercentile.Recommendation:
X:10,Y:1 day,W:<table of interest>,Z:99Criticality/Notification frequency: Low
- Advanced → Tables → TBL: Tombstones per Read (percentiles)
-
For a specified percentile, how many Tombstones are accessed during a read.
Condition: "<event>" is above
Xtombstones for more thanY<minutes|hours|days> forWtable atZpercentile.Recommendation:
X:tombstone_warn_thresholdincassandra.yaml,Y:1 day,W:<table of interest>,Z:99Criticality/Notification frequency: Low - Advanced → Tables → TBL: Partition Size (percentiles)
-
For a specified percentile, what is the size (in bytes) of partitions of this table.
Condition: "<event>" is above
Xfor more thanY<minutes|hours|days> forWtable atZpercentile.Recommendation:
X:200 MB(in bytes),Y:1 day,W:<table of interest>,Z:99Criticality/Notification frequency: Low
Tools for work with JMX
A number of tools exist for one-off analysis of specific metrics. Usually you only use these tools for debugging as they are not designed to replace monitoring solutions. These tools primarily provide access to individual metrics at the moment on a specific node. They do not generate a view of what happens over time or provide multiple metrics on multiple nodes.
- JConsole
-
Jconsole is a GUI tool included in a Java distribution, such as OpenJDK. Jconsole allows for easy browsing of the metrics and inspection of their values. It also provides the possibility to graph them over time.
Many more tools exist than are listed here.
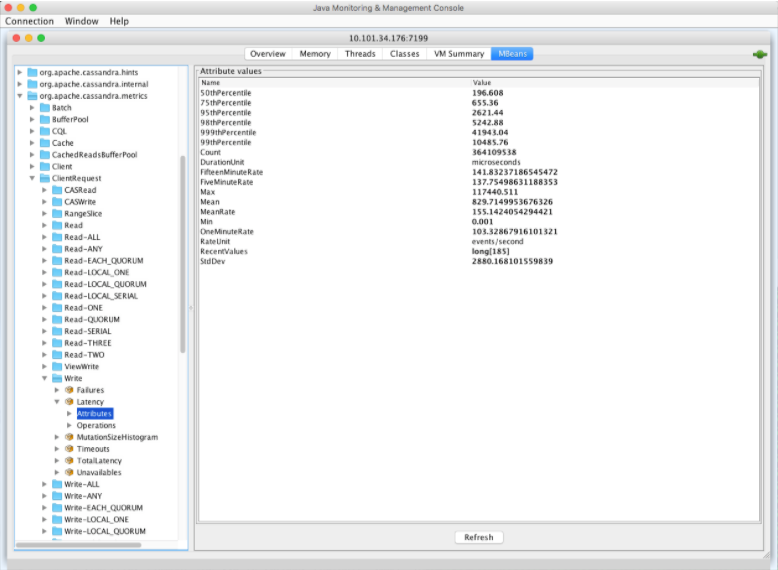 Java Monitoring and Management Console
To access metrics, JMX either needs to be running on the server (usually requiring installation of the GUI libraries), or to be accessible via the network, which exposes JMX externally and may have a security impact.
- jmxterm
-
jmxterm is a very popular JMX command-line tool. After downloading, it is easy to run and connect to a local node, or to other nodes when JMX is exposed externally:
open localhost:7199

_#Connection to localhost:7199 is opened_
You can access specific metrics with commands such as:
get -b org.apache.cassandra.metrics:type=Cache,scope=KeyCache,name=Size Value

#mbean = org.apache.cassandra.metrics:type=Cache,scope=KeyCache,name=Size:
Value = 0;
To get a full list of supported commands, run
helpinside the interactive console. In addition to obtaining the values for attributes, you can set values for attributes (if they are settable), or call the function, which you can use to temporarily modify the behavior of Cassandra (in the same way asnodetoolcommands are used). - nodetool sjk (DSE and Cassandra 4.0 and later)
-
DSE provides
nodetool sjk. This is a wrapper for the well-known library called Swiss Java Knife (SJK). This subcommand is convenient because you do not need to specify the DSE process PID or other parameters; you just provide necessary flags. For example, to get a hit rate of key cache, use the following command, where the-bflag specifies the name of the bean and the-fspecifies the field:nodetool sjk mx -b "org.apache.cassandra.metrics:type=Cache,scope=KeyCache,name=Size" -mg -f ValueSimilar to jmxterm, you can use this command to set values (when settable), or to call functions.
The scope of the SJK library is not limited to JMX. You can use it to get the thread dump, information about threads, and other functionality.
