Add an alert rule
DSE OpsCenter can alert operators when certain conditions are met, such as node failures or high read/write latency.
To define alert conditions, you must create alert rules in OpsCenter. Alert rules are based on metrics and monitored data at the table, cluster, and operating system levels, including:
-
Fixed conditions, such as node status or agent status
-
Percentile thresholds, such as read/write latency
-
Numeric thresholds, such as disk usage
For more information about the metrics and data that inform alert rules, see Alert metrics and Advanced system alert metrics.
Recommended alerts for production clusters
The following table describes useful alert rules for monitoring production clusters. Use these guidelines to populate the Add Alert fields when you create alert rules in OpsCenter. For conditions-based alerts, see Create an alert for a static condition. For metrics-based alerts, see Create an alert for a percentile or other threshold.
These rules are general recommendations that are useful for many production clusters. Create additional rules as needed, and adjust the suggested rules according to your business requirements and operational practices.
| Condition or metric | Trigger | Severity |
|---|---|---|
Node Down |
When a node is marked as down by OpsCenter for more than a given duration. Recommendation: Set the duration according to your cluster’s level of tolerance for down nodes.
Low replication and latency sensitive clusters should use short durations of For more information about how OpsCenter determines when a node is down, see Alert metrics. |
Urgent. Recommendation: Notify as frequently as possible. |
Agent Issue |
When the DataStax Agent running on a node in a monitored cluster experiences issues for more than a given duration. Recommendation: Set the duration to |
Low. Recommendation: Notify infrequently. |
CPU Usage |
When CPU usage exceeds a given threshold for a given duration. Recommendation: Notify when CPU Usage is above |
Low. Recommendation: Notify infrequently. |
Load |
When the total amount of work being processed exceeds a given threshold for a given duration. Recommendation: Notify when Load is above This ensures you are notified when long-lasting workload spikes occur. If this level of load continues for too long without scaling up the cluster, unacceptable performance degradation can occur. |
High. Recommendation: Notify frequently. |
Write Request Latency (percentiles) |
When the response time for successful write operations exceeds a given latency threshold for a given duration. Only monitors a specific percentile of write operations. Recommendation: Notify when writes in the 99th percentile are above The value of This alert monitors the latency of write requests at the specified percentile only. Monitoring all percentiles is noisy because lower percentiles inherently have lower latency. Use other alerts to monitor latency at lower percentiles or capture excessive numbers of slow writes. |
Moderate. Recommendation: Notify regularly. |
Read Request Latency (percentiles) |
When the response time for successful read operations exceeds a given latency threshold for a given duration. Only monitors a specific percentile of read operations. Recommendation: Notify when reads in the 99th percentile are above The value of This alert monitors the latency of read requests at the specified percentile only. Monitoring all percentiles is noisy because lower percentiles inherently have lower latency. Use other alerts to monitor latency at lower percentiles or capture excessive numbers of slow reads. |
Moderate. Recommendation: Notify regularly. |
Disk Usage (percentage) |
When disk usage for a disk partition exceeds a given threshold for a given duration. Recommendation: Notify when Disk Usage is above This metric is listed under Advanced > System. |
Moderate. Recommendation: Notify regularly. |
TBL: SSTables per Read (percentiles) |
When the number of SSTables accessed during reads exceeds a given threshold for a given duration. Only monitors SSTable access for a specific percentile of reads for a specific table. Recommendation: For a specific table, notify when reads in the 99th percentile are above To monitor multiple tables, create separate alerts for each table. At minimum, monitor the tables that are most important to your workloads. Monitoring all tables might be noisy and not useful. This metric is listed under Advanced > Tables. |
Low. Recommendation: Notify infrequently. |
TBL: Tombstones per Read (percentiles) |
When the number of tombstones accessed during reads exceeds a given threshold for a given duration. Only monitors tombstone access for a specific percentile of reads for a specific table. Recommendation: For a specific table, notify when reads in the 99th percentile are above Set To monitor multiple tables, create separate alerts for each table. At minimum, monitor the tables that are most important to your workloads. Monitoring all tables might be noisy and not useful. This metric is listed under Advanced > Tables. |
Low. Recommendation: Notify infrequently. |
TBL: Partition Size (percentiles) |
When the size of partitions for a table exceeds a given threshold for a given duration. Only monitors partition size for a specific percentile for a specific table. Recommendation: For a specific table, notify when operations in the 99th percentile are above To monitor multiple tables, create separate alerts for each table. At minimum, monitor the tables that are most important to your workloads. Monitoring all tables might be noisy and not useful. This metric is listed under Advanced > Tables. |
Low. Recommendation: Notify infrequently. |
Create an alert for a static condition
Alert categories based on static conditions rather than metrics, such as node status, are triggered when the monitored condition occurs and persists for a specified duration:
-
Click the Alerts menu.
-
In the Active Alerts dialog, click Manage Alerts.
-
On the Manage Alert Rules dialog, click Add Alert.
-
On the Add Alert dialog, configure the alert rule.
-
Notify me when: Select the alert category, such as Agent Issue or Node Down. For more information and examples, see Recommended alerts for production clusters.
-
For more than: Specify how long the condition must be present before triggering the alert.
-
Additional options: Depending on the alert category, additional choices might be required, such as a specific table to monitor.
-
Notify every: Select how frequently to send notifications once the alert is triggered. This is a reflection of the alert’s importance. For the most critical alerts, select a more frequent notification interval.
The following example creates an Agent Issue alert that is triggered after 5 minutes and then sends notifications every 5 minutes until the triggering issue is resolved.

-
-
Click Save Alert.
Example: Cluster Out of Balance alert
The following example defines an alert rule to detect imbalanced partition token ranges in single-token clusters so that you can manually redistribute tokens. This isn’t necessary for clusters using vnodes due to automatic redistribution of tokens. For more information about partition token distribution, see DSE data distribution.
-
Notify me when: Cluster Out of Balance
-
For more than: 5 minutes
-
Notify every: 5 minutes

Example: KMIP Error alert
The following example defines an alert rule to monitor the status of a DSE KMIP encryption server:
-
Notify me when: KMIP Error
-
For more than: 5 minutes
-
Notify every: 5 minutes
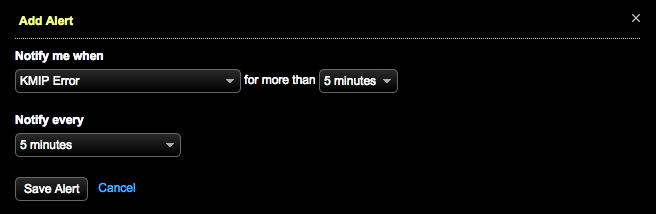
If a DSE node is unable to contact the KMIP server, or if a node is not authorized by the KMIP server, check the OpsCenter Event Log for messages about the cause and possible resolution for the issue.
Example: Node Down alert
The following example defines an alert rule to detect nodes that are down for an extended amount of time:
-
Notify me when: Node Down
-
For more than: 5 minutes
-
Notify every: 5 minutes

Depending on the replication factor and cluster architecture, Cassandra-based clusters can typically tolerate one or more node failures without data loss or availability issues. A Node Down alert is meant to capture nodes that are down for an extended amount of time, requiring operator intervention such as manual repair or node replacement.
This rule isn’t meant to alert on every outage the moment it occurs. Adjust the duration and notification frequency as needed to avoid excessive false positives due to intermittent network issues, restarts, and other short-term outages that the cluster can recover from automatically.
Create an alert for a percentile or other threshold
Alert categories that are based on metrics are triggered when the monitored metric exceeds a specified threshold for a given duration. The threshold can be a percentile or a fixed numeric value, depending on the alert category.
-
Click the Alerts menu.
-
In the Active Alerts dialog, click Manage Alerts.
-
On the Manage Alert Rules dialog, click Add Alert.
-
On the Add Alert dialog, configure the alert rule.
The first group of Add Alert fields create a complete sentence describing the alert condition in the form of
Notify me when METRIC is ABOVE/BELOW THRESHOLD for more than DURATION.-
Notify me when: Select an alert category that supports threshold alerts, such as CPU Usage or Load. For more information and examples, see Recommended alerts for production clusters.
-
Is above/below: Select whether the alert is triggered when the actual value is above or below a specified threshold.
If the Add Alert dialog doesn’t show the above/below menu, then the selected category (Notify me when) doesn’t support threshold alerts.
-
Threshold: Define the alert threshold by selecting above or below, and entering a number representing a percentile, percentage, or other value, depending on the alert category. Don’t include units or symbols in the threshold field; only enter the number. For example, if the threshold is a percentage, enter a number like
99, not99%.Depending on the selected category, the Add Alert dialog might show the monitored metric’s most recently recorded value. For histogram percentile metrics, this is the value over the last minute. When configuring alert rules for active production clusters, the current value helps you verify that you chose the appropriate percentile to monitor, and that your alert rule is reasonable compared to current performance. For new clusters, there might not be enough data to show a realistic value.
-
for more than: Specify how long the condition must be present before triggering the alert.
-
Histogram Aggregation Window: If applicable to the alert category, specify a time window for histogram aggregation. This is separate from the duration (for more than).
If a histogram aggregation window is specified, the percentile is calculated from the data points recorded within the window. For example, a one-minute histogram aggregation window calculates the percentile based on the data points collected within the last minute.
To create an alert that is more sensitive to spikes, decrease the histogram aggregation window. DataStax recommends a one-minute histogram aggregation window.
-
Additional options: Depending on the alert category, additional choices might be required, such as a specific table to monitor.
-
Notify every: Select how frequently to send notifications once the alert is triggered. This is a reflection of the alert’s importance. For the most critical alerts, select a more frequent notification interval.
The following example shows a threshold alert for In-Memory Percent Used:

-
-
Click Save Alert.
Example: Tiered Storage alerts
Configure DSE Tiered Storage alerts to monitor data distribution for storage tiers:
-
Notify me when: Under Advanced, select DSE, and then select TIER: Total Disk Used or TIER: SSTables.
Alerts aren’t supported for TIER: Max Data Age, but you can create a graph for this metric.

-
Threshold: Configure the threshold amount and duration according to the selected metric and your monitoring requirements.
-
Select table: Select a specific Tiered Storage table to monitor.
-
Select tier: Select a specific storage tier to monitor.
-
Notify every: Set the notification frequency according to your requirements.

|
For centralized management of your Tiered Storage configuration, you can configure the strategy and tiers with Lifecycle Manager (LCM), and then run a configuration job to push the Tiered Storage configuration to all applicable nodes. |
Example: In-Memory Percent Used alert
The following example defines an alert rule to monitor the percentage of memory allocated for DSE In-Memory tables that is currently in use. The alert is triggered when usage exceeds the specified threshold for the given duration. This alert can indicate that you need to increase the memory allocated for In-Memory tables.
-
Notify me when: Under Advanced, select DSE, and then select In-Memory Percent Used.

-
Threshold: Select above, and enter
15for the percentage threshold. -
For more than: 5 minutes
-
Notify every: 5 minutes
View and manage alert rules
You can view, create, edit, and delete alert rules from the Manage Alert Rules dialog:
-
Click the Alerts menu.
A badge on the Alerts menu indicates the number of active alerts, if any.

-
In the Active Alerts dialog, click Manage Alerts to open the Manage Alert Rules dialog.
Your alert rules are listed on the Manage Alert Rules dialog. The following example shows one alert rule. If you don’t have any alert rules, the list is empty.

-
To create a rule, click Add Alert.
-
Within the list of alert rules, you can take the following actions on existing rules:
-
Enable: Activate a rule that was previously deactivated. Rules are active by default when you add them.
-
Disable: Deactivate a rule that is currently active.
-
Edit: Modify a rule’s conditions and notification frequency.
-
Delete: Remove a rule.
-
Monitor and investigate alerts
After you create an alert, notifications are generated if the alert condition is triggered. Notification targets and methods depend on your notification configuration.
If an alert is triggered, investigate the issue in the appropriate area of the OpsCenter UI, log files, or DSE cluster, depending on the alert category. For example:
-
Agent Issue alert: Check the Agents View and agent log files.
-
KMIP Server alert: Check the Event Log.
-
Cluster Out of Balance alert: For single-token clusters only, check the partition token distribution and, if needed, modify the cluster configuration to manually redistribute tokens.
