Viewing TP stats in Node Details

About this task

View thread pool statistics for active, pending, completed, blocked, and total blocked processes from the Node Details dialog.

Thread pools statistics can also be monitored in the Performance Service.

Procedure

  1. Click cluster name > Nodes.

  2. In the Ring or List view, select the node to view its details.

    The Node Details dialog appears.

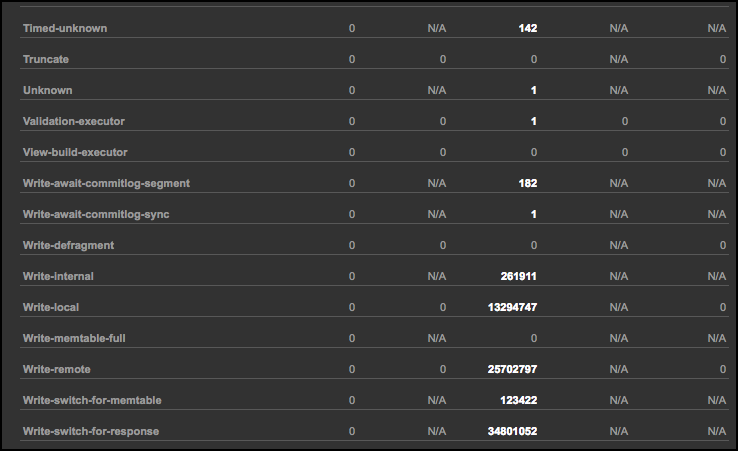
  3. Scroll down to the Thread Pool Stats pane.

    The Active, Pending, Completed, Blocked, and Total Blocked columns tally the number of threads for each metric. N/A indicates when a particular thread stage is not applicable to a metric.

    View Thread Pool Stats in Node Details dialog

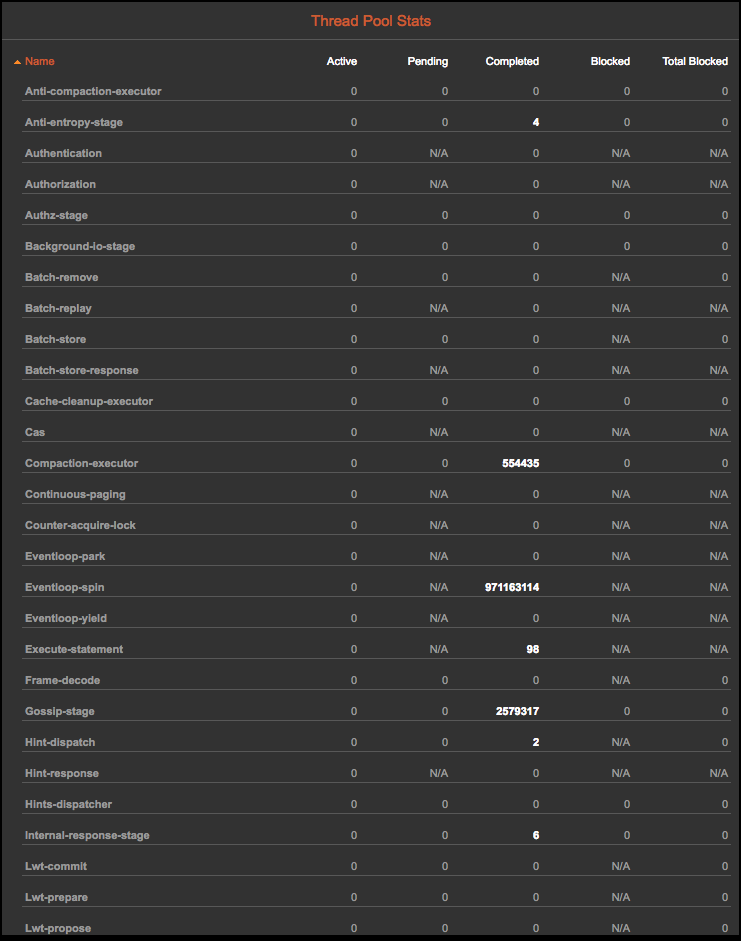
    There are many thread pool statistics available.

    View <strong>Thread Pool Stats</strong> in <strong>Node Details</strong> dialog continued. Scroll to view the complete list.

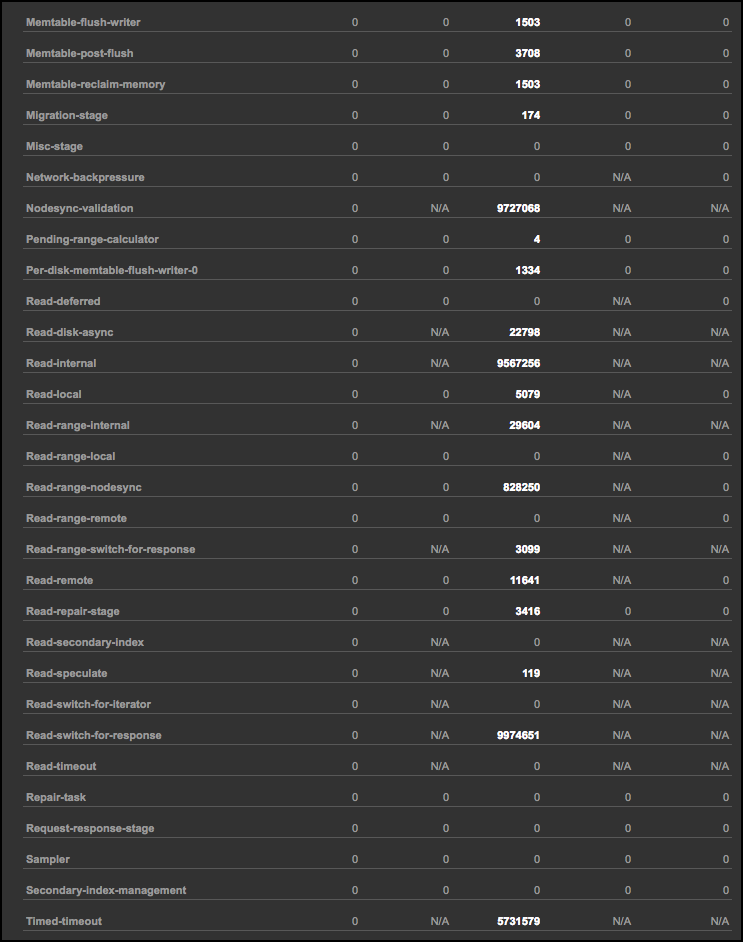
    Use the scroll bar to view them in their entirety.

    View <strong>Thread Pool Stats</strong> in <strong>Node Details</strong> dialog continued. Scroll to view the complete list.

Was this helpful?

Give Feedback

How can we improve the documentation?

© 2024 DataStax | Privacy policy | Terms of use

Apache, Apache Cassandra, Cassandra, Apache Tomcat, Tomcat, Apache Lucene, Apache Solr, Apache Hadoop, Hadoop, Apache Pulsar, Pulsar, Apache Spark, Spark, Apache TinkerPop, TinkerPop, Apache Kafka and Kafka are either registered trademarks or trademarks of the Apache Software Foundation or its subsidiaries in Canada, the United States and/or other countries. Kubernetes is the registered trademark of the Linux Foundation.

General Inquiries: +1 (650) 389-6000, info@datastax.com