Add dashboard graphs for datacenter and node messaging latency
Add graphs to the OpsCenter Monitoring Dashboard to monitor latency between datacenters and nodes.
-
Click Cluster > Dashboard.
-
Click Add Graph.
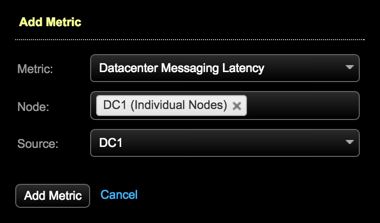
The Add Metric dialog appears.
-
Complete the dialog for each metric graph:
-
Choose Datacenter Messaging Latency from the Metric list.

-
Choose the nodes to monitor from the Node list. Available options:
-
Cluster-wide
-
All nodes
-
Datacenter (aggregate)
-
Datacenter (individual nodes)
-
A single specific node
If multiple selections are made in the Node list, reported latencies are aggregated for all selections.
-
-
Select the datacenter from the Source list.
-
Click Add Metric.
-
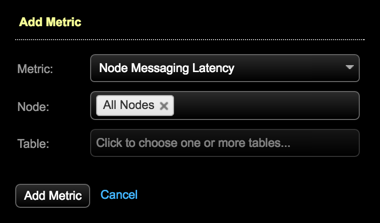
Repeat the procedure for the Node Message Latency metric. Selecting a source datacenter is not applicable to node-level graphs.

-
Add as many variations of these metrics as required for your environment. When finished, click Save Graph.
The graphs appear in the dashboard.

-
