Graph metrics
Reference of available graph metrics in OpsCenter Monitoring for DSE Graph. Alerts are also available for all Graph metrics.
Metrics for monitoring DSE Graph in OpsCenter include:
-
Cache metrics: Cache metrics bound to a specific DSE Graph. Per node per graph instance metrics.
-
Request Latencies: Histogram of request latencies.
-
Thread pool metrics: Global-level thread pool metrics for tasks that have active, pending, and completed threads.
Graph cache metrics
Metrics for hits and misses to the adjacency and index caches used by DSE Graph.
-
Graph Classic: Adjacency Cache Hits
Number of hits against the adjacency cache for this graph.
-
Graph Classic: Adjacency Cache Misses
Number of misses against the adjacency cache for this graph.
-
Graph Classic: Index Cache Hits
Number of hits against the index cache for this graph.
-
Graph Classic: Index Cache Misses
Number of misses against the index cache for this graph.
Graph transaction latencies
-
Graph Classic: Request Latencies
The min, median, max, 90th, and 99th percentile of request latencies during the period.
Graph thread pool metrics
Graph query threads, Graph scheduled threads, Graph system threads, and Graph Gremlin worker metrics for pending, active, and completed threads in the respective thread pools.
Thread pool metrics are global across all graphs.
-
Graph Classic TP: Graph Scheduled Threads Pending
Number of pending tasks in the GraphScheduledThreads thread pool.
-
Graph TP: Graph Scheduled Threads Active
Number of active tasks in the GraphScheduledThreads thread pool.
-
Graph Classic TP: Graph Scheduled Threads Completed
Number of tasks completed by the GraphScheduledThreads thread pool.
-
Graph Classic TP: Graph System Threads Pending
Number of pending tasks in the GraphSystemThreads thread pool.
-
Graph Classic TP: Graph System Threads Active
Number of active tasks in the GraphSystemThreads thread pool.
-
Graph Classic TP: Graph System Threads Completed
Number of tasks completed by the GraphSystemThreads thread pool.
-
Graph Classic TP: Gremlin Worker Threads Pending
Number of pending tasks in the GremlinWorkerThreads thread pool.
-
Graph Classic TP: Gremlin Worker Threads Active
Number of active tasks in the GremlinWorkerThreads thread pool.
-
Graph Classic TP: Gremlin Worker Threads Completed
Number of tasks completed by the GremlinWorkerThreads thread pool.
Dashboard Graphs for Graph Metrics
Dashboard graphs are available for all Graph metrics in OpsCenter. Click Cluster > Dashboard > Add Graph. Select the metric from the Metric list in the Add Metric dialog:
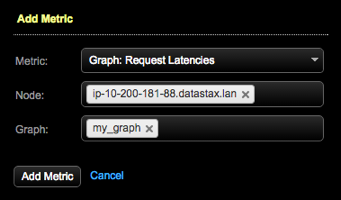
The Graph list is only applicable to the per graph cache metrics.
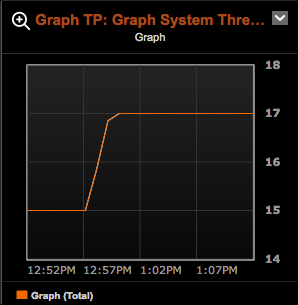
After adding metrics and clicking Save Graph, the graphs appear on the monitoring dashboard.
|
Clone the Default preset tab and give it a name such as DSE Graph to organize your dashboard. |
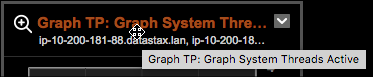
Long graph titles are truncated in the dashboard. Hover over the graph title to view a tooltip containing the complete graph name.
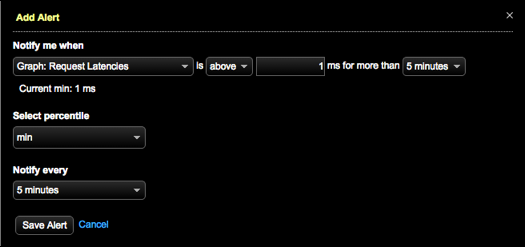
Graph Alerts
Alerts are available for all graph metrics. Click Alerts > Notify me when > Advanced > Graph > Graph metric in the Add Alert dialog.
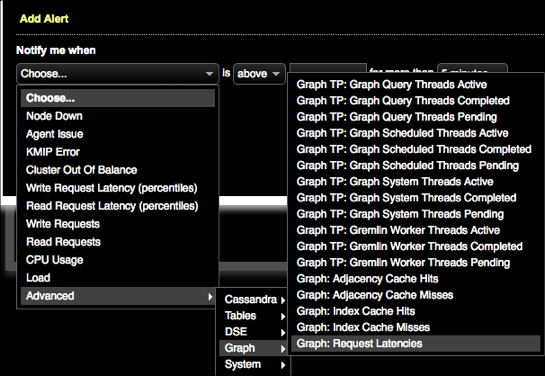
Define the notification criteria for each alert required for monitoring your DSE Graph environment.