Performance Service tasks
The DSE OpsCenter Performance Service provides visual monitoring of diagnostics collected through the DSE Performance Service, including alerts and recommendations for optimizing cluster performance. The DSE OpsCenter Performance Service combines OpsCenter metrics with CQL-based diagnostic tables populated by the DSE Performance Service to help understand, tune, and optimize cluster performance.
Performance Service overview panels
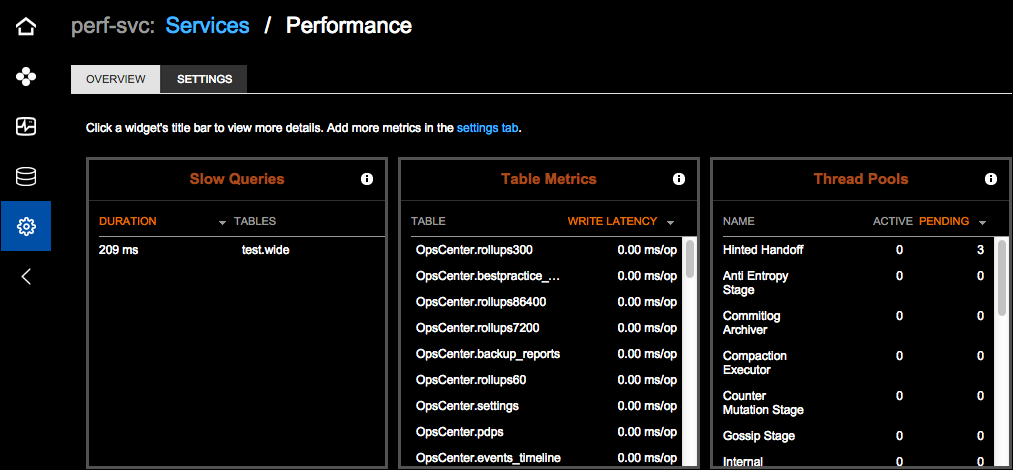
Enable the performance metrics panels and visually analyze the results within OpsCenter. Currently, the performance overview panels include:
-
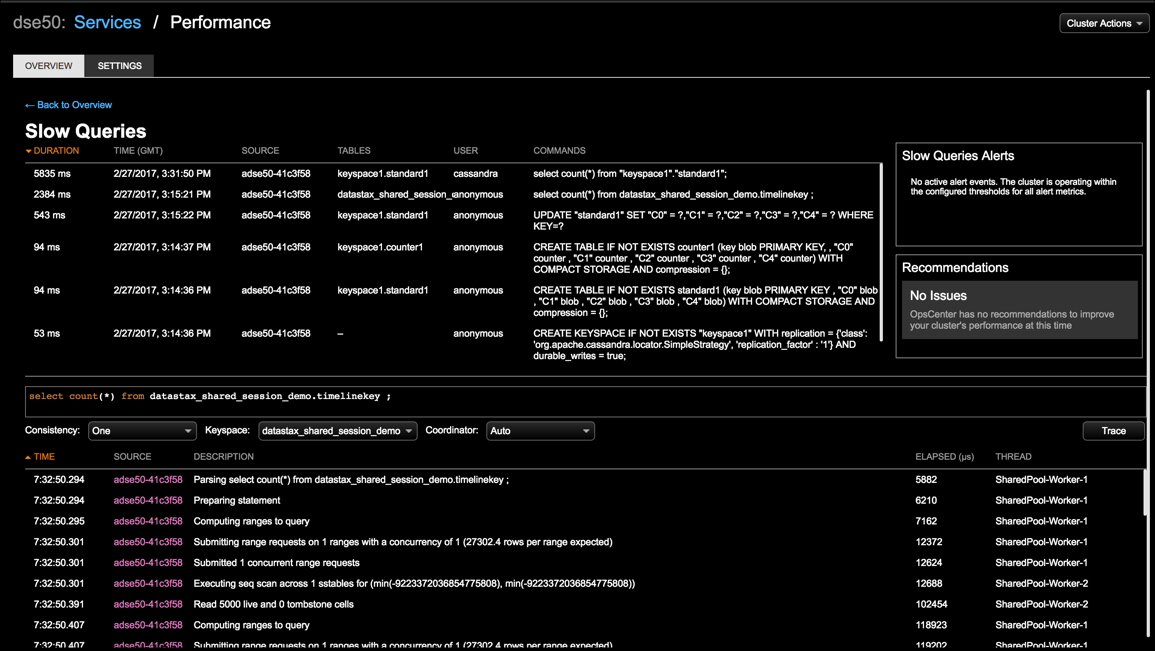
Slow Queries: Information to help identify slow queries on a cluster to tune poorly performing queries.
-
Table Metrics: Metrics to discover and diagnose poorly performing tables.
-
Thread Pool Statistics: Information about
Cassandrasystem-level details such as thread pools.

Each panel contains a read-only high-level summary with pertinent sortable columns. Clicking the title bar of a panel opens its expanded performance page:

Alerts panel
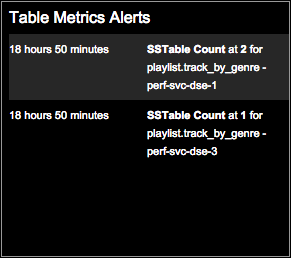
On each performance page in OpsCenter, an alerts panel feed lists triggered alerts. Any alerts you configure specifically for your environment appear in the panel.
|
Alerts for the Performance Service are not pre-configured. |
For guidance on configuring alerts for Performance Service, refer to the sample setup scenario sections:

Recommendations panel
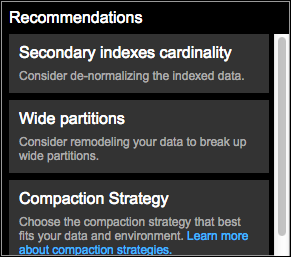
On each performance page in OpsCenter, a panel provides recommendations to rectify and improve performance issues.

Best Practice Service - Performance Service Advisors
The Performance Service integrates with the Best Practice Service. Any rules that fail send an alert to the relevant Alerts panel in each performance page, and generate suggestions to remediate issues in the Recommendations panels. The Best Practice Service monitors rules configured for the Performance Service Advisors:

By default, all rules are enabled and scheduled to run every hour. Adjust the rule configuration to suit the requirements of your environment.
