Example alert setup scenario for slow queries
Follow these guidelines to configure latency alerts for monitoring slow queries. Any alerts triggered for read and write latencies appear in the Slow Queries Alerts panel within the Slow Queries performance page. Some suggested basic alerts to configure include:
-
Write Request Latency - above 50 ms/op for more than one minute; also for more than 5 minutes
-
Read Request Latency - above 50 ms/op for more than one minute; also for more than 5 minutes
-
Local Write Latency - above 50 ms/op for more than one minute; also for more than 5 minutes
Local latency alerts are available from Advanced > Tables. Configure the pertinent latency alerts of interest with thresholds appropriate for your environment.
-
Click the Alerts menu.
-
In the Active Alerts dialog, click Manage Alerts.
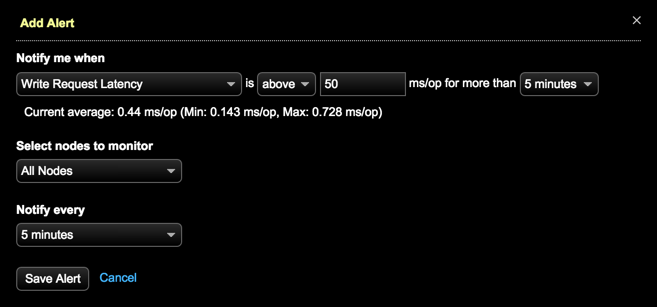
The Add Alert dialog appears.
-
In the Notify me when menu, choose a r/w latency metric name.
Click Advanced > Tables to set up table latency alerts.
-
Select the alert notification criteria:
-
Select the nodes to monitor for cluster-level alerts.
-
Select the table for local latency alerts.
-
-
Click Save Alert.
The alert appears in the Manage Alert Rules list. Repeat these steps for each additional alert.
