Dropped Messages metrics
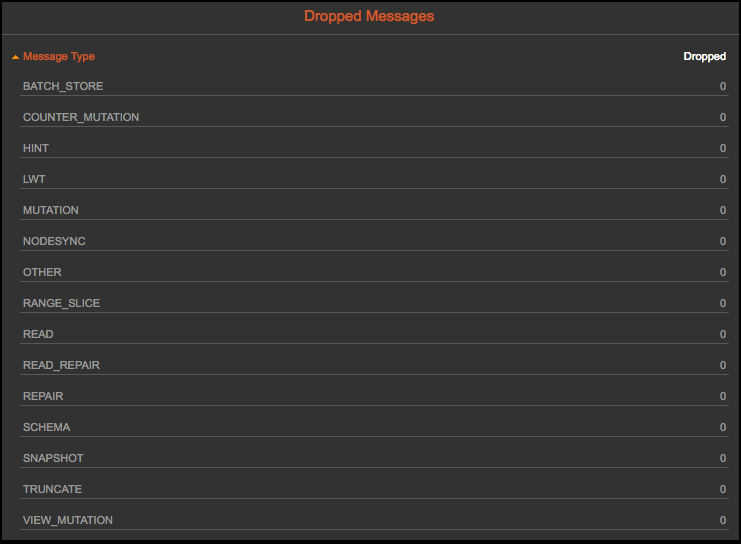
Reference of Dropped Messages metrics available for dashboard graphs and alerts in OpsCenter Monitoring. View a tally of dropped messages for a node in the Dropped Messages pane of the Node Details dialog. Dropped messages can indicate system stress that could impact node health.

-
Dropped Messages: All [all-dropped]
Aggregate of all messages that have been dropped server-side due to not having been processed before their respective timeout.
-
Dropped Messages: Batch Store [dropped-batch-store]
Batch store message was seen after the timeout so was thrown away.
-
Dropped Messages: Counter Mutations [dropped-counter-mutations]
Mutation was seen after the timeout (write_request_timeout_in_ms) so was thrown away. This client might have timed out before it met the required consistency level, but might have succeeded as well. Hinted handoffs and read repairs should resolve inconsistencies but a repair can ensure it.
-
Dropped Messages: Hinted Handoffs [dropped-hints]
Hinted Handoff was seen after the timeout (write_request_timeout_in_ms) so was thrown away. Repairing the data or using NodeSync, should resolve data inconsistencies.
-
Dropped Messages: Lightweight Transactions [dropped-lwt]
Lightweight Transaction was seen after the timeout (write_request_timeout_in_ms) so was thrown away. This client might have timed out before it met the required consistency level, but might have succeeded as well. Hinted handoffs and read repairs should resolve inconsistencies but a repair can ensure it.
-
Dropped Messages: Materialized View Mutations [dropped-view-mutations]
Mutation of Materialized View was seen after the timeout (write_request_timeout_in_ms) so was thrown away. This client might have timed out before it met the required consistency level, but might have succeeded as well. Hinted handoffs and read repairs should resolve inconsistencies but a repair can ensure it.
-
Dropped Messages: Miscellaneous [dropped-other]
Miscellaneous message was seen after the timeout so was thrown away.
-
Dropped Messages: Mutations [dropped-mutations]
Mutation was seen after the timeout (write_request_timeout_in_ms) so was thrown away. This client might have timed out before it met the required consistency level, but might have succeeded as well. Hinted handoffs and read repairs should resolve inconsistencies but a repair can ensure it.
-
Dropped Messages: NodeSync [dropped-node-sync]
NodeSync message was seen after the timeout so was thrown away.
-
Dropped Messages: Ranged Slice Reads [dropped-ranged-slice-reads]
A local ranged read request was received after the timeout (range_request_timeout_in_ms) so it was thrown away because it would have already either been completed and sent to client or sent back as a timeout error.
-
Dropped Messages: Reads [dropped-reads]
A local read request was received after the timeout (read_request_timeout_in_ms) so it was thrown away because it would have already either been completed and sent to client or sent back as a timeout error.
-
Dropped Messages: Read Repairs [dropped-read-repairs]
The Mutation was seen after the timeout (write_request_timeout_in_ms) so was thrown away. With the read repair timeout, the node still exists in an inconsistent state.
-
Dropped Messages: Repair Messages [dropped-repairs]
Repair message was seen after the timeout so was thrown away.
-
Dropped Messages: Schema Changes [dropped-schemas]
Schema change was seen after the timeout (request_timeout_in_ms) so was thrown away. Schema agreement may not have been reached immediately, but this will eventually resolve itself.
-
Dropped Messages: Snapshot Requests [dropped-snapshots]
Snapshot Request was seen after the timeout (request_timeout_in_ms) so was thrown away. Snapshot should be retried.
-
Dropped Messages: Truncate Operations [dropped-truncates]
Truncate operation was seen after the timeout (truncate_request_timeout_in_ms) so was thrown away.
Dropped Messages dashboard graphs
Dashboard graphs are available for all Dropped Messages metrics in OpsCenter:
-
Click Cluster > Dashboard > Add Graph.
-
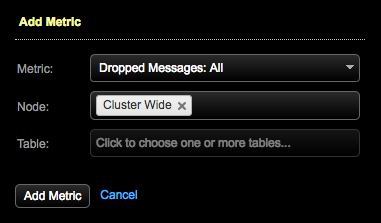
In the Add Metric dialog, select a metric from the Metric list to add to the graph.

-
Click Save Graph to open the graph on the monitoring dashboard.
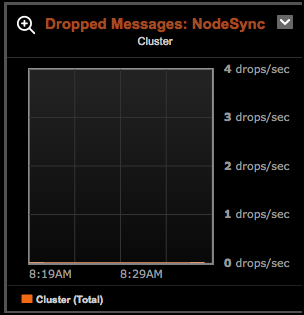
In the following example, no messages are dropped for NodeSync.

Clone the Default preset tab and give it a friendly name, such as
DroppedMessages, to help organize your dashboard.
Dropped Messages alerts
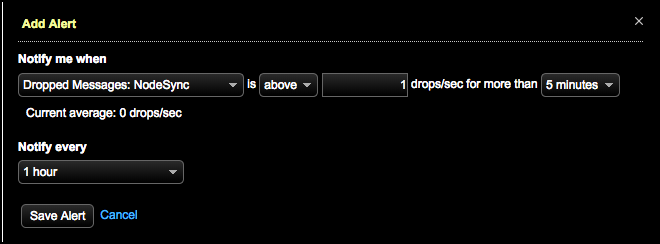
Alerts are available for all dropped messages metrics. Click Alerts > Notify me when > Advanced > Cassandra > Dropped Messages: metric in the Add Alert dialog.
Define the notification criteria for each alert required for monitoring your environment.

