Forecast trends for metric graphs
Use forecasting to predict trends in metric graphs based on historical data:
-
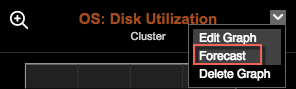
In the Dashboard, locate the metric graph to forecast and click Forecast from the graph menu.
-
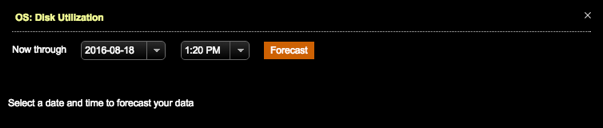
Select the date and time for the end of the predicted trend timeframe.
The end date and time must be a minimum of two days in the future, up to a maximum of one year.
-
Click Forecast.
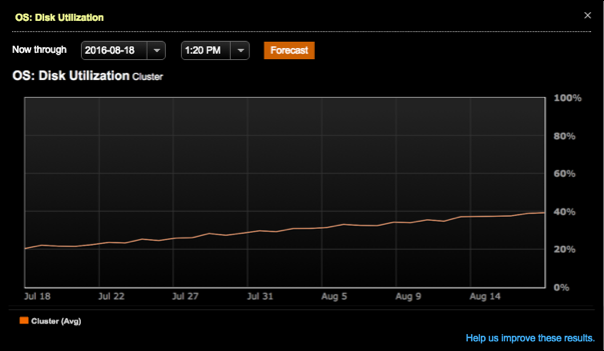
The forecast shows the predicted metric trend for the selected timeframe. The following example shows that node disk usage will double from 20% to 40% in one month. In this case, admins should consider adding capacity now.
-
If you want to help DataStax improve your predicted trends, you can forward your results or comments to DataStax engineers by clicking Help us improve these results.
Enter your name, a valid email address, any any comments about the forecast. If you want to include the forecast data, select Include this forecast data with my feedback.
