Advanced system alert metrics
Configure advanced system metrics for memory, CPU, and disk metrics on Linux or Mac OS X.
As with any database system, Cassandra performance greatly depends on underlying systems on which it is running.
Before configuring advanced system metric alerts, you should first have an understanding of the baseline performance of your hardware and the averages of these system metrics when the system is handling a typical workload.
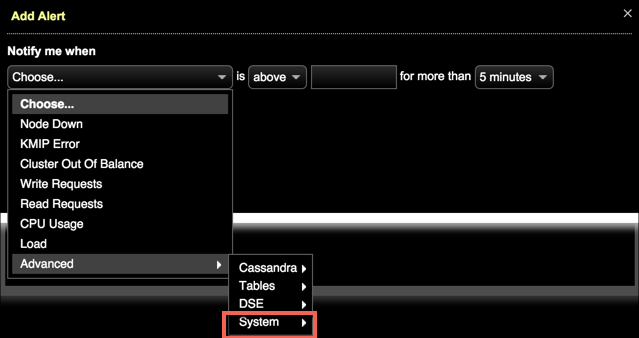
To access Advanced System metrics, choose Advanced > System in the Add Alert dialog.
Linux memory metrics
| Metric | Definition |
|---|---|
Memory free |
System memory that is not being used. |
Memory used |
System memory used by application processes. |
Memory buffered |
System memory used for caching file system metadata and tracking in-flight pages. |
Memory shared |
System memory that is accessible to `CPU`s. |
Memory cached |
System memory used by the |
Linux CPU metrics
| Metric | Definition |
|---|---|
Idle |
Percentage of time the |
Iowait |
Percentage of time the |
Nice |
Percentage of time spent processing prioritized tasks. Niced tasks are also counted in system and user time. |
Steal |
Percentage of time a virtual |
System |
Percentage of time allocated to system processes. |
User |
Percentage of time allocated to user processes. |
Linux disk metrics
| Metric | Definition |
|---|---|
Disk usage |
Percentage of disk space |
Free disk space |
Available disk space in GB. |
Used disk space |
Used disk space in GB. |
Disk read throughput |
Average disk throughput for read operations in megabytes per second. Exceptionally high disk throughput values may indicate I/O contention. |
Disk write throughput |
Average disk throughput for write operations in megabytes per second. |
Disk read rate |
Averaged disk speed for read operations. |
Disk write rate |
Averaged disk speed for write operations. |
Disk latency |
Average time consumed by disk seeks in milliseconds. |
Disk request size |
Average size in sectors of requests issued to the disk. |
Disk queue size |
Average number of requests queued due to disk latency. |
Disk utilization |
Percentage of |
Mac OS X memory metrics
| Metric | Definition |
|---|---|
Free memory |
System memory that is not being used. |
Used memory |
System memory that is being used by application processes. |
Mac OS X CPU metrics
| Metric | Definition |
|---|---|
Idle |
Percentage of time the |
System |
Percentage of time allocated to system processes. |
User |
Percentage of time allocated to user processes. |
Mac OS X disk metrics
| Metric | Definition |
|---|---|
Disk usage |
Percentage of disk space |
Free space |
Available disk space in GB. |
Used disk space |
Used disk space in GB. |
Disk throughput |
Average disk throughput for read/write operations in megabytes per second. Exceptionally high disk throughput values may indicate I/O contention. |
Partition name limitation for disk usage alerts
When configuring a disk usage alert for multiple nodes, the partition names must be named the same on every node. For example, if you want to alert when disk space on your commit log partition is running low, the commit log partition must be named the same on every node. Currently, the OpsCenter UI only shows the drives from one of the nodes.
