Ring View
The Ring View displays the cluster as a ring of nodes from which node health, data distribution, and datacenter balance is determined at a glance within a single visualization.
- Nodes are positioned around the ring according to their assigned token. In the case of ByteOrderedPartioner or vnodes, nodes are displayed as slices of the ring and sized based on the percentage of data they own.
- If the data center has more nodes than can be displayed on the screen, it will be represented as a condensed ring view. This typically occurs when the data center has hundreds of nodes.
- The color of each node represents its health, which is determined by system load average (the number shown by the uptime command). Per core: 0–0.999 is Normal (green); 1–5 is Medium (yellow); 5+ is High (red). A summary of the cluster's health is located within the ring.
- The size of each node represents its data size, relative to all other nodes in the cluster.
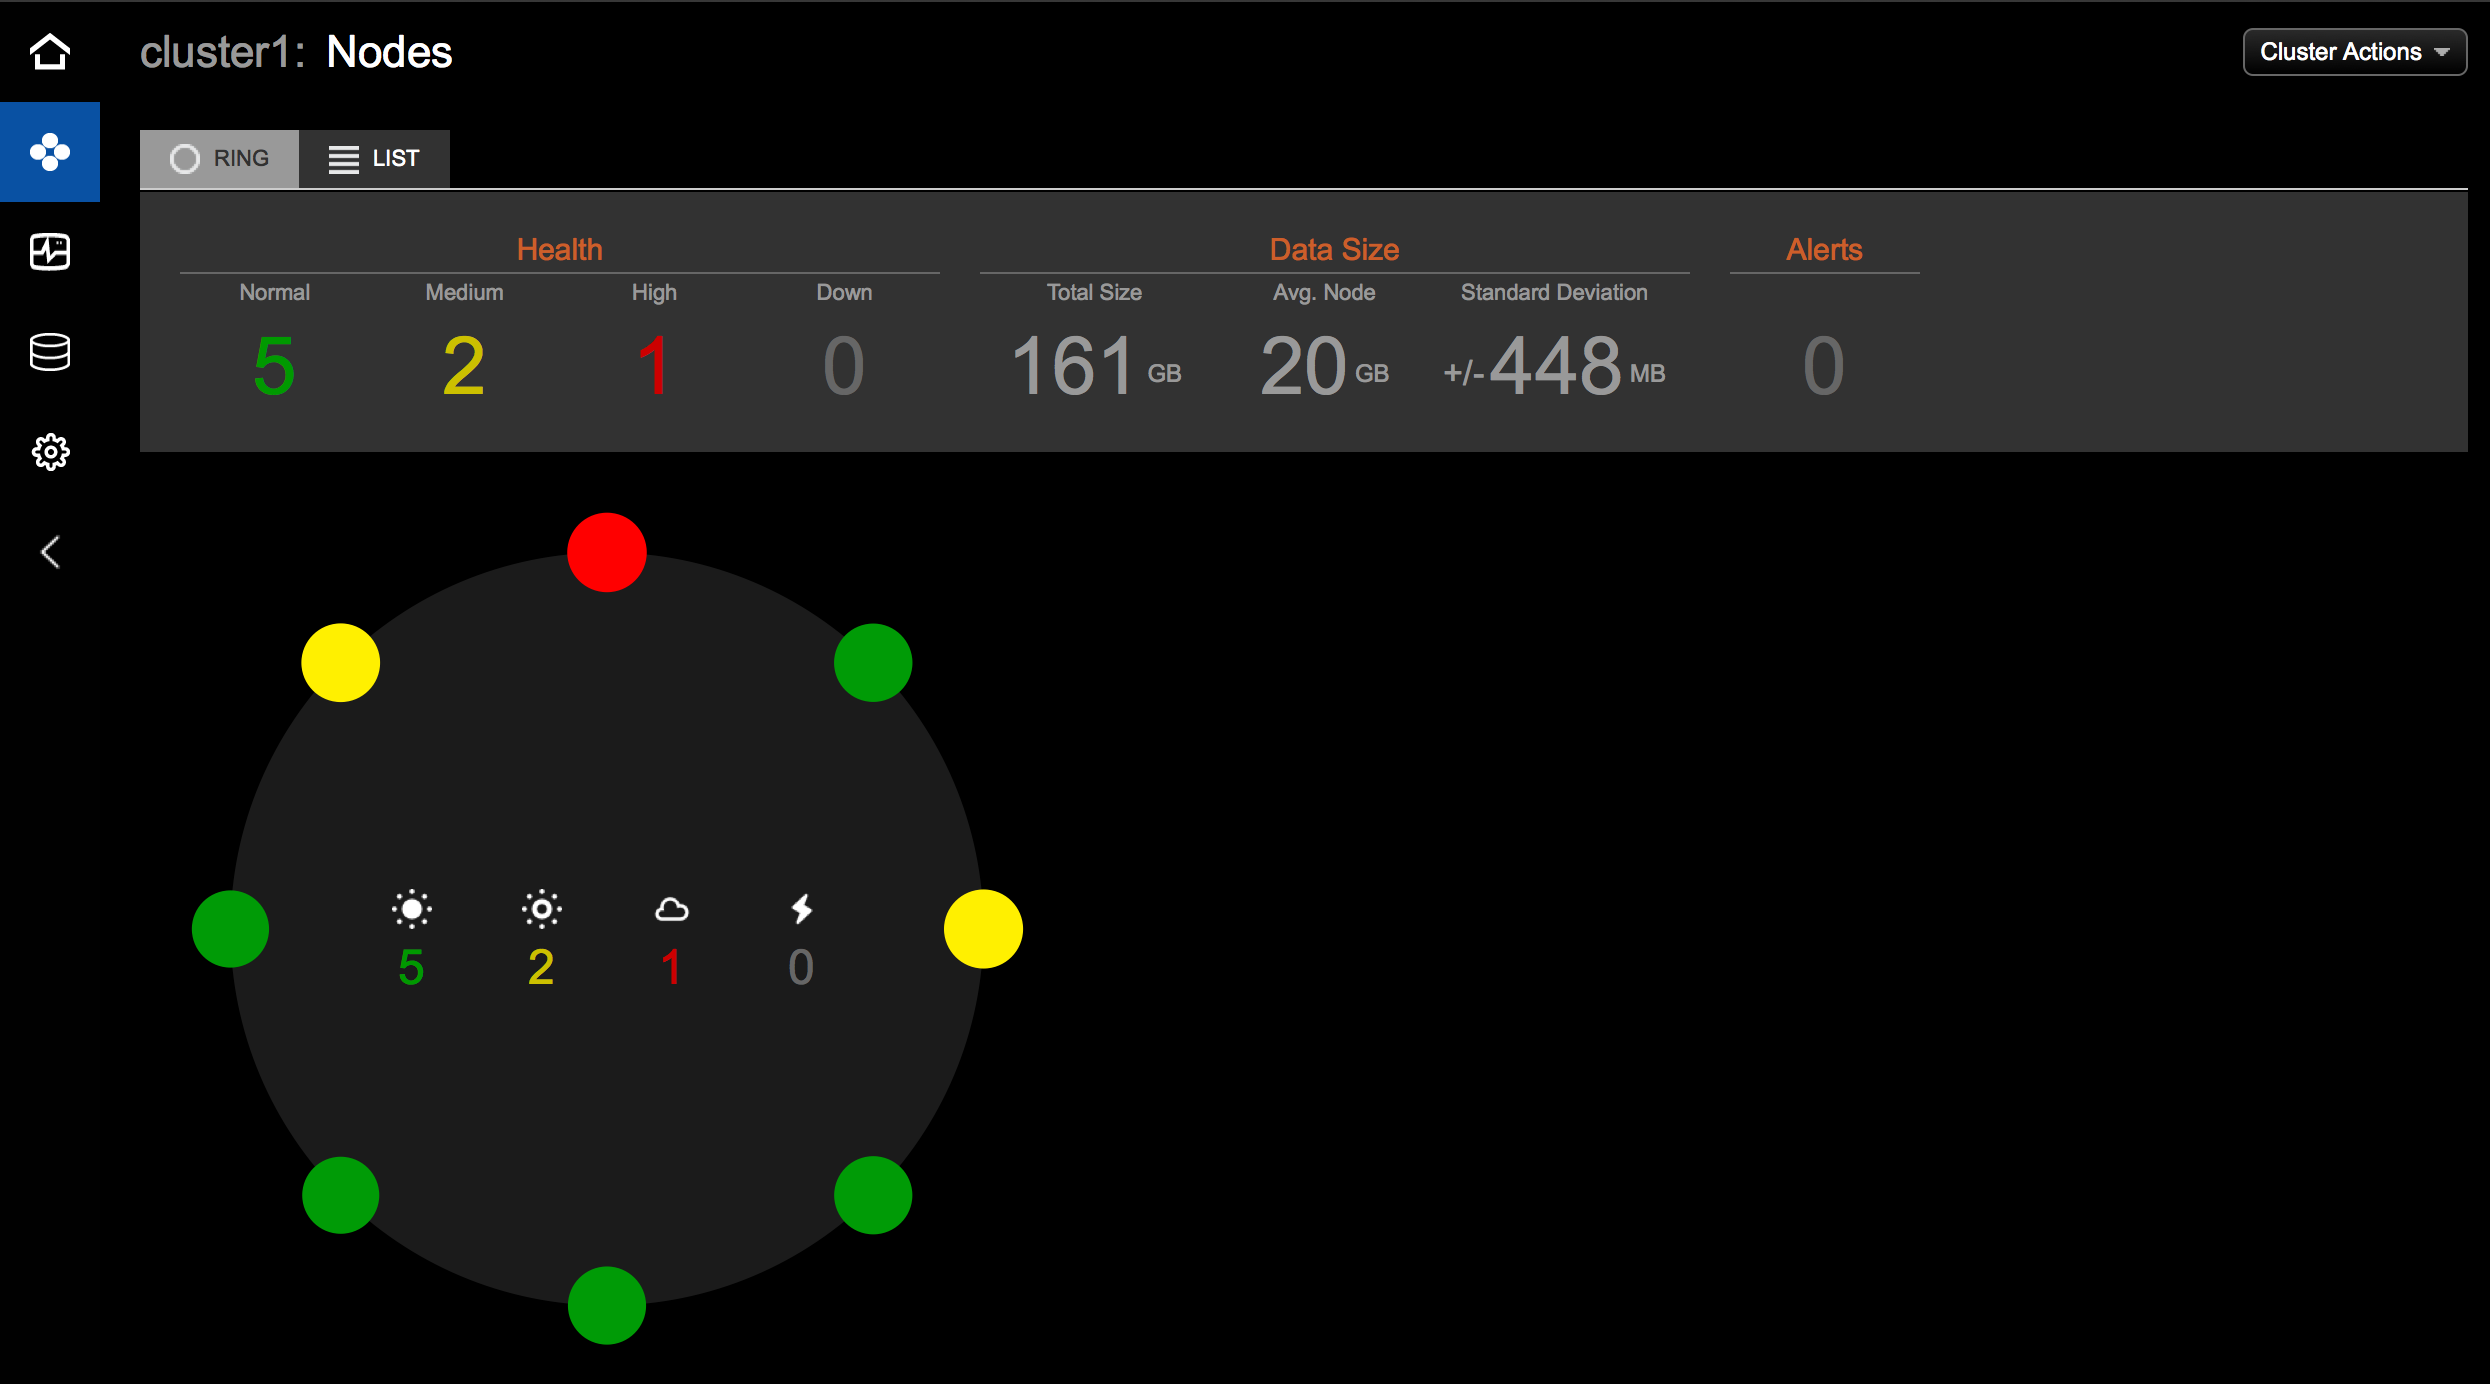
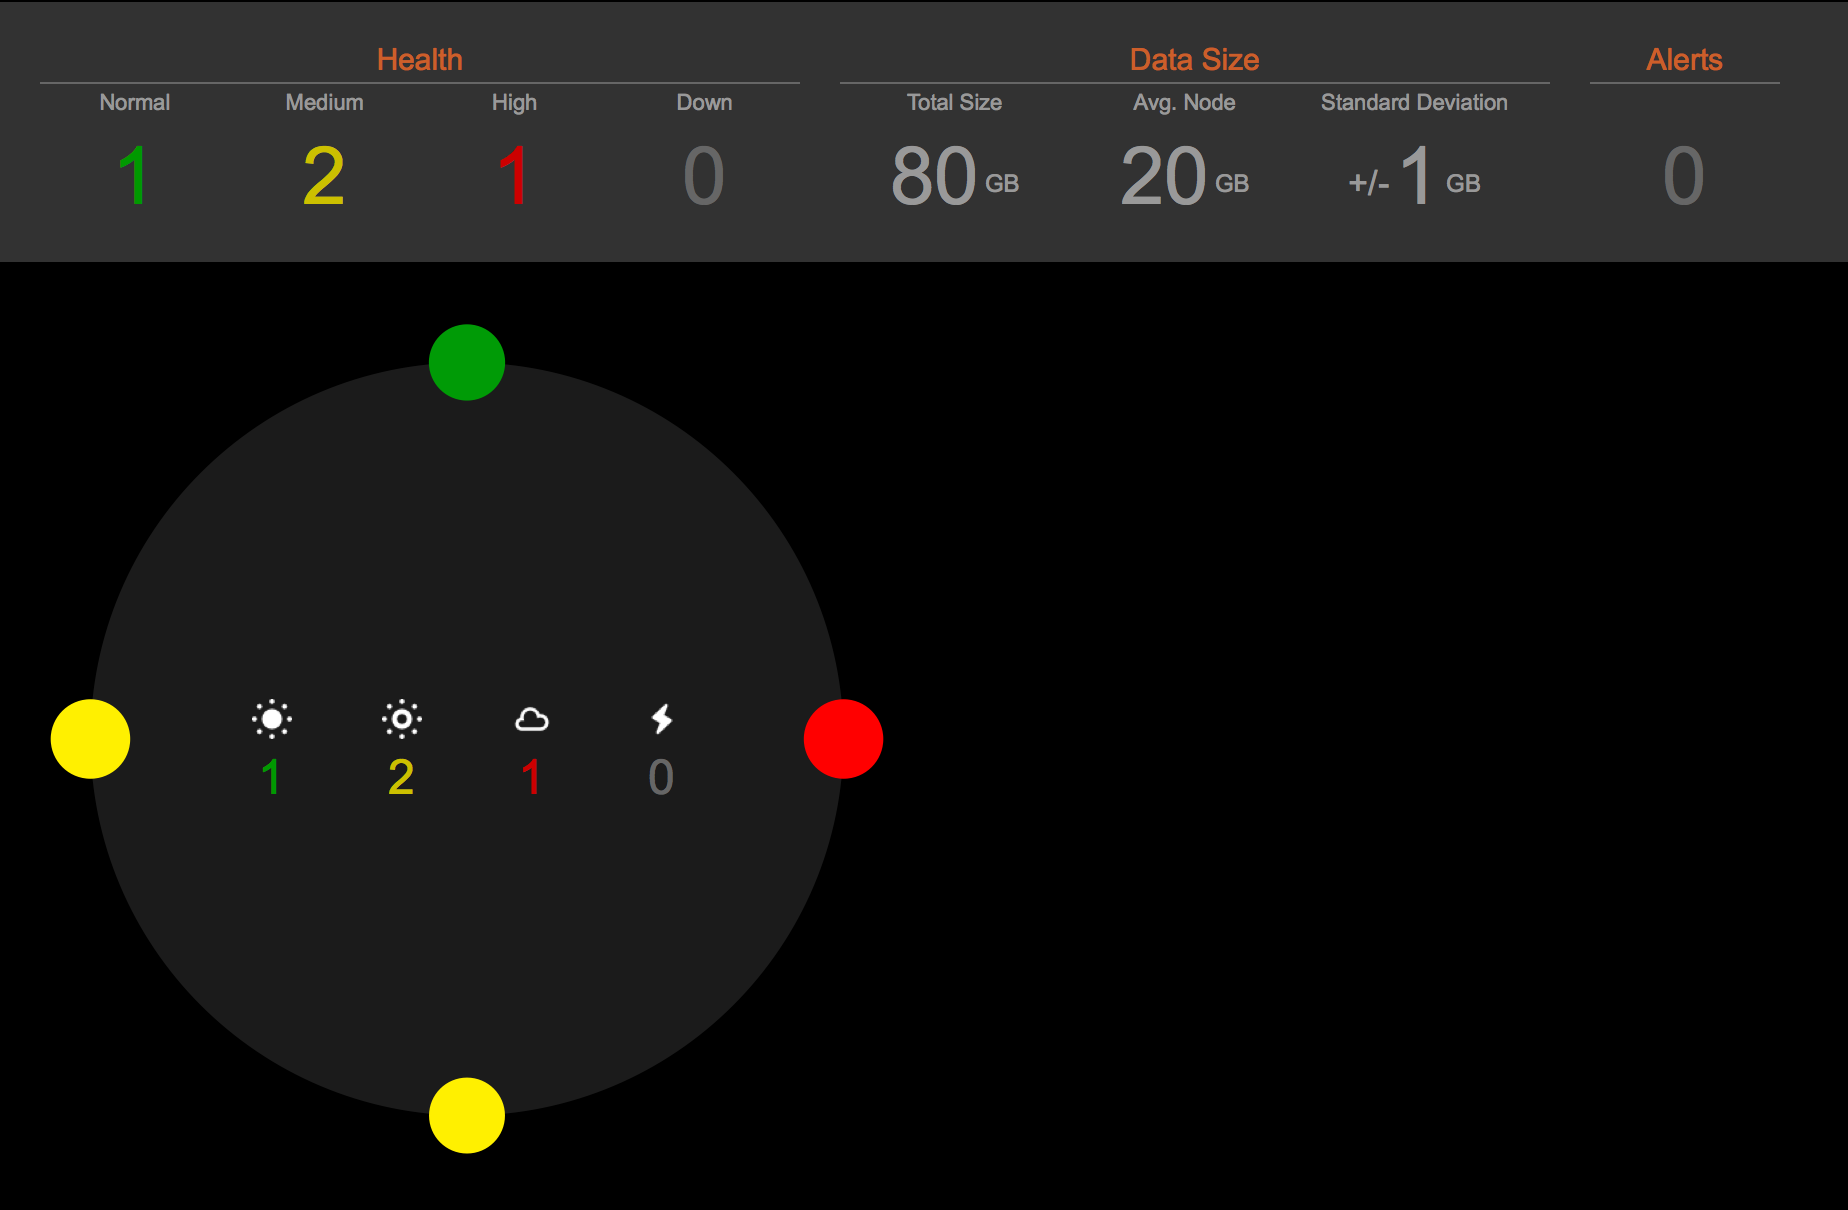
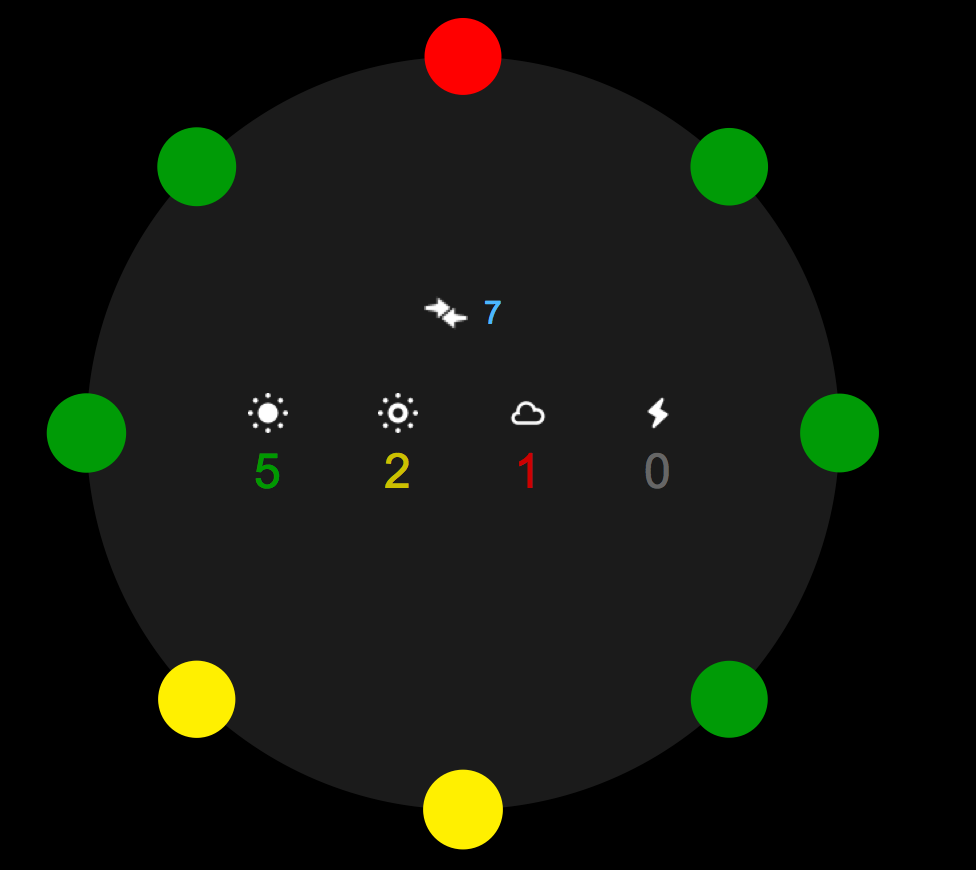
Health summary
The health summary pane, located above the rings, contains a cluster-wide summary of the data represented within the rings. You can quickly get an idea of the health of your cluster without having to manually scan each ring. This is especially useful with larger clusters.
Hovering over a number in the health summary will highlight the nodes included in that total. You can easily identify potential problem nodes, as well as whether or not multiple nodes within a single replica set are having issues.
Clicking on the totals in the health summary presents a list of nodes included in the total.
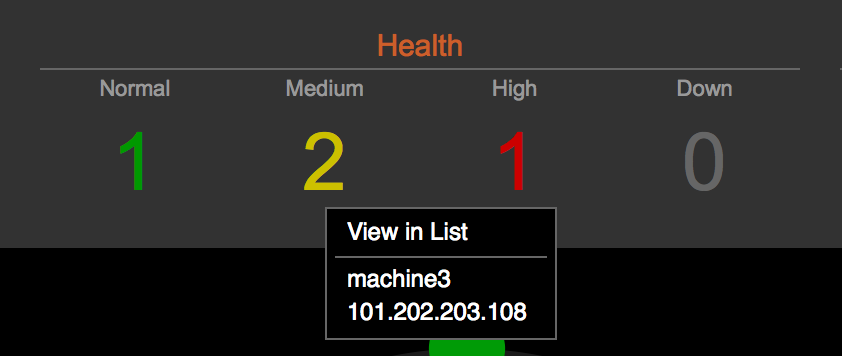
A health summary of each data center is located within the ring. Clicking the totals presents a lost of nodes included in the total.
Node details
Hovering over a node displays some basic details about that node. These details are updated in real time.
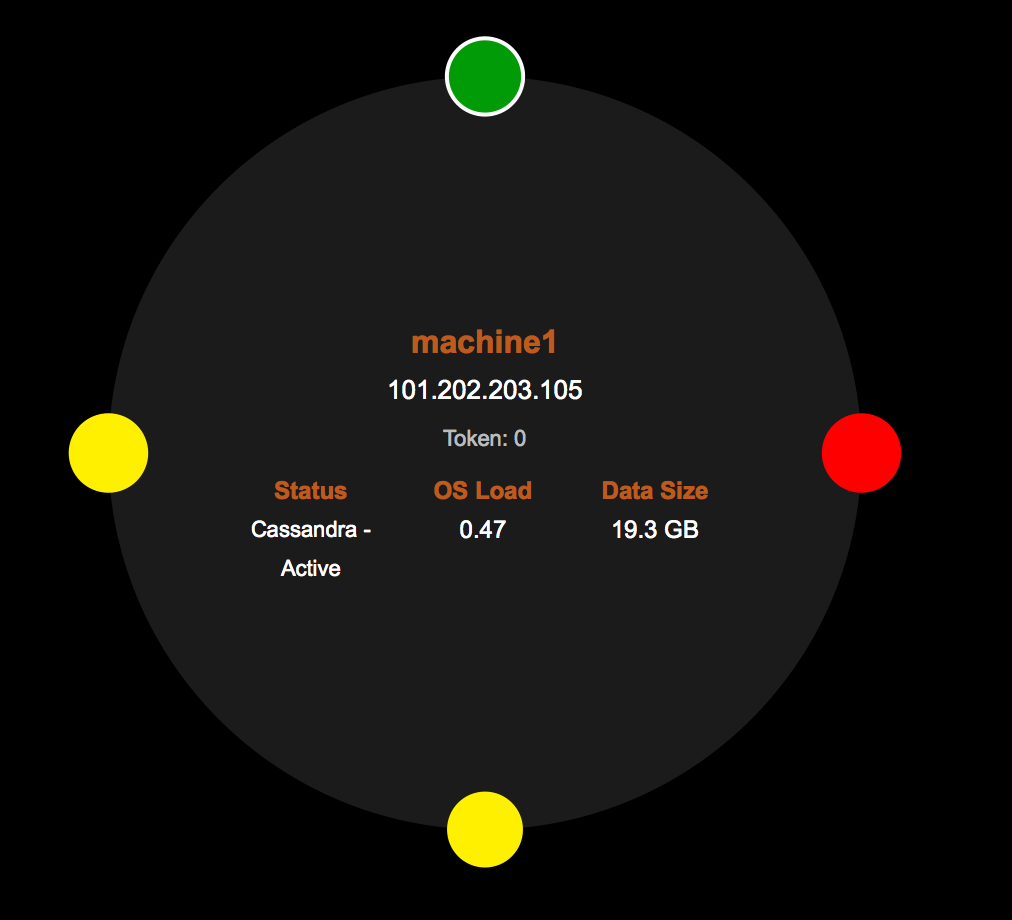
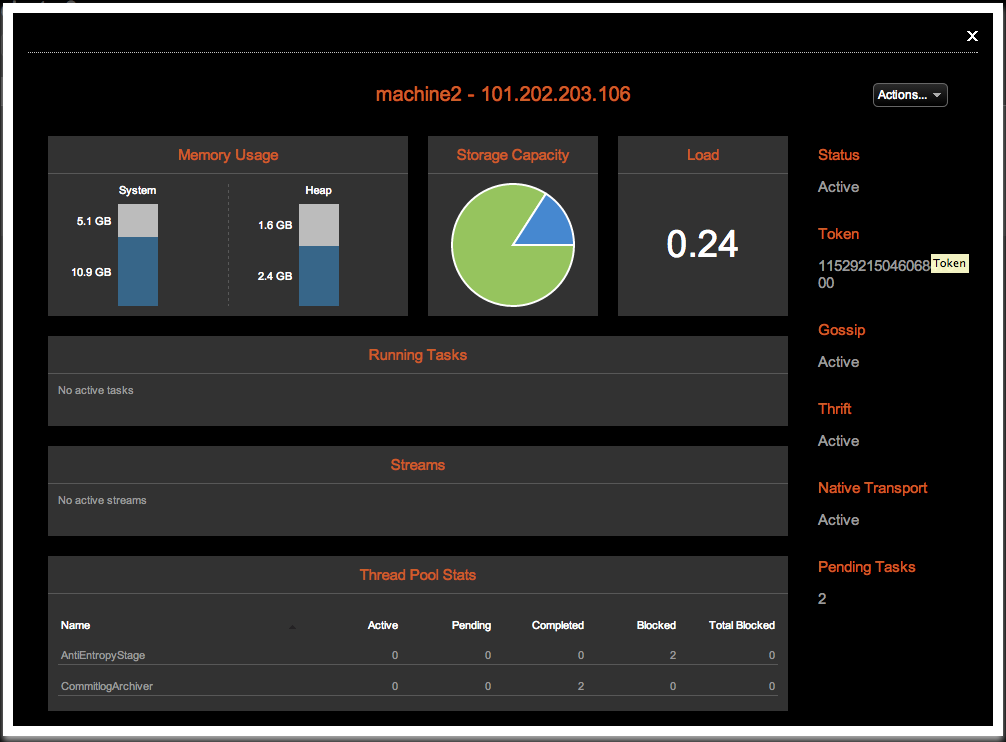
Clicking a node reveals a dialog displaying more information so you can run various operations on the node.
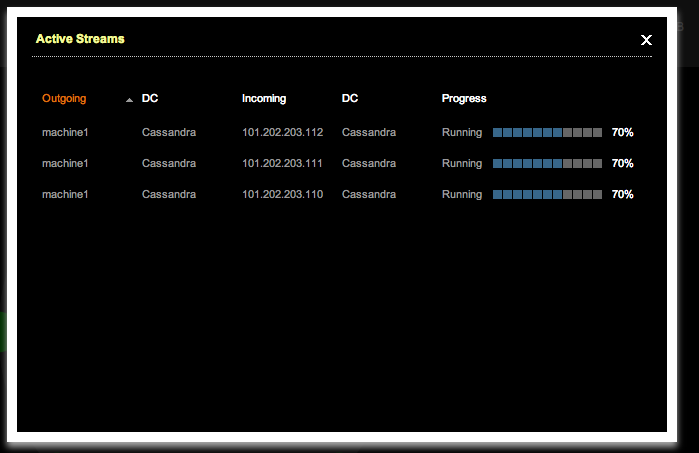
Streams
An icon is displayed inside of the ring whenever any nodes in that data center are streaming data to or from another node in the cluster. The icon distinguishes between streams contained within that data center ("intra-dc streams") and streams between data centers ("inter-dc streams").
Clicking on the icon in any data center opens the Streams dialog, which gives details on all the streams in the cluster.
Node positioning
The goal of positioning nodes in a ring is to visually represent whether a datacenter is balanced or not (that is, data is more likely to be evenly distributed across nodes). In a healthy ring, nodes will be spread out evenly around the ring.
When a cluster uses RandomPartitioner or Murmur3Partitioner for its snitch, its nodes are positioned around the ring according to their assigned token, but there are some cases where positioning by token does not make sense:
- If vnodes are enabled, each node is made up of multiple virtual nodes (256 by default), so positioning by token would mean having hundreds of times as many nodes around the ring.
- If a partitioner that doesn't use consistent hashing is used, such as ByteOrderedPartitioner, data is not guaranteed to be distributed evenly, so positioning by token also has no guaranteed value
In those cases, nodes are positioned based on the percentage of data they own in the ring, so a healthy ring is still represented by nodes being evenly spaced out.
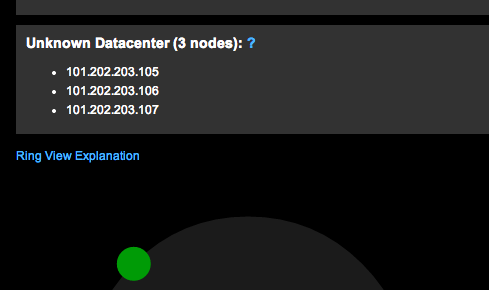
Unknown datacenter list
Rings are displayed by data center. This information is gathered from the agent that runs on each node. If a new data center has just been added, or if new nodes have been added to the cluster, it is displayed in a special list above all rings until OpsCenter fully processes the new cluster information.