Monitoring a Cassandra cluster
Understanding the performance characteristics of your Cassandra cluster is critical to diagnosing issues and planning capacity.
Understanding the performance characteristics of a Cassandra cluster is critical to diagnosing issues and planning capacity.
Cassandra exposes a number of statistics and management operations via Java Management Extensions (JMX). Java Management Extensions (JMX) is a Java technology that supplies tools for managing and monitoring Java applications and services. Any statistic or operation that a Java application has exposed as an MBean can then be monitored or manipulated using JMX.
During normal operation, Cassandra outputs information and statistics that you can monitor using JMX-compliant tools, such as:
- The Cassandra nodetool utility
- DataStax OpsCenter management console
- JConsole
Using the same tools, you can perform certain administrative commands and operations such as flushing caches or doing a node repair.
Monitoring using nodetool utility
The nodetool utility is a command-line interface for monitoring Cassandra and performing routine database operations. Included in the Cassandra distribution, nodetool and is typically run directly from an operational Cassandra node.
The nodetool utility supports the most important JMX metrics and operations, and includes other useful commands for Cassandra administration. This utility is commonly used to output a quick summary of the ring and its current state of general health with the status command. For example:
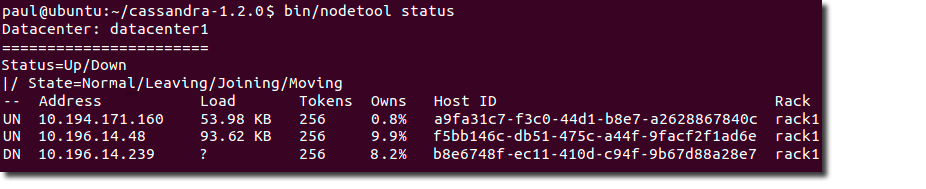
The nodetool utility provides commands for viewing detailed metrics for tables, server metrics, and compaction statistics. Commands include decommissioning a node, running repair, and moving partitioning tokens.
The nodetool cfstats command
The nodetool cfstats command displays statistics for each table and keyspace. This example shows an excerpt of the output of the command after flushing a table of wikipedia data to disk.
----------------
Keyspace: wiki
	Read Count: 3589
	Read Latency: 1.9554240735580943 ms.
	Write Count: 3579
	Write Latency: 0.32189075160659397 ms.
	Pending Tasks: 0
		Column Family: solr
		SSTable count: 1
		Space used (live): 9592399
		Space used (total): 9592399
		SSTable Compression Ratio: 0.5250859637980083
		Number of Keys (estimate): 3584
		Memtable Columns Count: 0
		Memtable Data Size: 0
		Memtable Switch Count: 1
		Read Count: 3589
		Read Latency: 1.955 ms.
		Write Count: 3579
		Write Latency: 0.322 ms.
		Pending Tasks: 0
		Bloom Filter False Positives: 0
		Bloom Filter False Ratio: 0.00000
		Bloom Filter Space Used: 4488
		Compacted row minimum size: 180
		Compacted row maximum size: 219342
		Compacted row mean size: 5559
----------------
| Name of statistic | Example value | Brief description | Related information |
|---|---|---|---|
| Keyspace | wiki | Name of the keyspace | Keyspace and table storage configuration |
| Read count | 3589 | Number of local read requests for the keyspace since start up | |
| Read latency | 1.9554240735580943 ms. | Read latency of tables in the keyspace | OpsCenter alert metrics |
| Write count | 3579 | Number of local write requests for the keyspace since start up | Same as above |
| Write latency | 0.32189075160659397 ms. | Write latency of tables in the keyspace | Same as above |
| Pending tasks | 0 | Tasks in the queue for reads, writes, and cluster operations of tables in the keyspace | OpsCenter pending task metrics |
| Column family | solr | Name of the Cassandra table | |
| SSTable count | 1 | Number of SSTables containing data from the table | How to use the SSTable counts metric and OpsCenter alert metrics |
| Space used (live) | 9592399 | Bytes, the space that is measured depends on operating system | Advanced system alert metrics |
| Space used (total) | 9592399 | Same as above | Same as above |
| SSTable compression ratio | 0.5250859637980083 | Percentage of reduction in data-representation size resulting from compression | Types of compression ( sstable_compression option ) |
| Number of keys (estimate) | 3584 | Sum of storage engine rows (containers for columns) in each SStable, approximate (within 128) | |
| Memtable columns count | 0 | Number of cells (storage engine rows x columns) of data in the memtable | Cassandra memtable structure in memory |
| Memtable data size | 0 | Size in bytes of the memtable data | Same as above |
| Memtable switch | 1 | Number of times a full memtable was swapped for an empty one that increases each time the memtable for a table is flushed to disk | How memtables are measured article |
| Read count | 3589 | Number of local read requests for the table since start up | OpsCenter alert documentation |
| Read latency | 1.955 ms. | Round trip time to complete a read request in milliseconds | Factors that affect read latency |
| Write count | 3579 | Number of local write requests for the table since start up | OpsCenter alert documentation |
| Write latency | 0.322 ms. | Round trip time to complete a read request in milliseconds | Factors that affect write latency |
| Pending tasks | 0 | Number of read, write, and cluster operations that are pending | OpsCenter pending task metrics documentation |
| Bloom filter false positives | 0 | Number of false positives, which occur when the bloom filter said the row existed, but it actually did not exist in absolute numbers | Tuning bloom filters |
| Bloom filter false ratio | 0.00000 | Fraction of all bloom filter checks resulting in a false positive | Same as above |
| Bloom filter space used | 4488 | Bytes of bloom filter data | Same as above |
| Compacted row minimum size | 180 | Lower size limit in MB for table rows being compacted in memory | Used to calculate what the approximate row cache size should be. Multiply the reported row cache size, which is the number of rows in the cache, by the compacted row mean size for every table and sum them. |
| Compacted row maximum size | 219342 | Upper size limit in bytes for compacted table rows, configurable in the cassandra.yaml (in_memory_compaction _limit_in_mb) | Same as above |
| Compacted row mean size | 5559 | The average size in bytes of compacted table rows | Same as above |
The nodetool cfhistograms command
The nodetool cfhistograms command provides statistics about a table, including read/write latency, row size, column count, and number of SSTables.
The syntax of the command is:
nodetool cfhistograms <keyspace> <table>
For example, to get statistics about the solr table in the wiki keyspace on Linux, use this command:
cd <install_location>/bin
    nodetool cfhistograms wiki solr
An example of output is:
wiki/solr histograms
Offset      SSTables     Write Latency      Read Latency          Row Size      Column Count
1               3579                 0                 0                 0                 0
2                  0                 0                 0                 0                 0
. . .
35                 0                 0                 0                 0                 0
42                 0                 0                27                 0                 0
50                 0                 0               187                 0                 0
60                 0                10               460                 0                 0
72                 0               200               689                 0                 0
86                 0               663               552                 0                 0
103                0               796               367                 0                 0
124                0               297               736                 0                 0
149                0               265               243                 0                 0
179                0               460               263                 0                 0
. . .
25109160           0                 0                 0                 0                 0
The Offset column corresponds to the x-axis in a histogram. It represents buckets of values. More precisely, it is a series of ranges where each offset includes the range of values greater than the previous offset and less than or equal to the current offset. The offsets start at 1 and each subsequent offset is calculated by multiplying the previous offset by 1.2, rounding up, and removing duplicates. The offsets can range from 1 to approximately 25 million, with less precision as the offsets get larger.
Columns of metrics represent the number of values that fall into a particular offset's range. Latencies are shown in terms of microseconds (µs), Row Size is in bytes, and SSTables and Column Count are counts.
To illustrate:
- Offset 1 shows that 3579 requests only had to look at one SSTable. The SSTables column corresponds to how many SSTables were involved in a read request.
- Offset 86 shows that there were 663 requests with a write latency between 73 and 86 µs. The range falls into the 73 to 86 bucket.
OpsCenter, described later on this page, displays the same information in an better format for understanding the statistics.
The netstats command
The nodetool netstats command provides statistics about network operations and connections.
The syntax of the command is:
nodetool cfnetstats <host>
An example of output is:
Mode: NORMAL
Not sending any streams.
Not receiving any streams.
Read Repair Statistics:
Attempted: 1
Mismatch (Blocking): 0
Mismatch (Background): 0
Pool Name                    Active   Pending      Completed
Commands                        n/a         0              0
Responses                       n/a         0              0
-
Attempted
The number of successfully completed read repair operations
-
Mismatch (blocking)
The number of read repair operations since server restart that blocked a query.
-
Mismatch (background)
The number of read repair operations since server restart performed in the background.
-
Pool name
Information about client read and write requests by thread pool.
nodetool tpstats command
The nodetool tpstats command provides statistics about the number of active, pending, and completed tasks for each stage of Cassandra operations by thread pool. A high number of pending tasks for any pool can indicate performance problems.
The syntax of the command is:
nodetool tpstats
An example of output is:
Pool Name                    Active   Pending      Completed   Blocked  All time blocked
ReadStage                         0         0             15         0                 0
RequestResponseStage              0         0              0         0                 0
MutationStage                     0         0           3674         0                 0
ReadRepairStage                   0         0              0         0                 0
ReplicateOnWriteStage             0         0              0         0                 0
GossipStage                       0         0              0         0                 0
AntiEntropyStage                  0         0              0         0                 0
MigrationStage                    0         0              0         0                 0
MemoryMeter                       0         0              1         0                 0
MemtablePostFlusher               0         0            267         0                 0
FlushWriter                       0         0              9         0                 1
MiscStage                         0         0              0         0                 0
commitlog_archiver                0         0              0         0                 0
InternalResponseStage             0         0              0         0                 0
HintedHandoff                     0         0              0         0                 0

Message type           Dropped
RANGE_SLICE                  0
READ_REPAIR                  0
BINARY                       0
READ                         0
MUTATION                     0
_TRACE                       0
REQUEST_RESPONSE             0
| Name of statistic | Brief description | Related information |
|---|---|---|
| ReadStage | Performing a local read | |
| RequestResponse | Handling responses from other nodes | |
| MutationStage | Performing a local write. | A high number of pending write requests indicates a problem handling them. Tune hardware or Cassandra configuration. |
| ReplicateOnWrite | Performing counter writes, replicates after a local write | |
| GossipStage | Handling gossip rounds every second | |
| AntiEntropyStage | Repairing consistency | nodetool repair |
| MigrationStage | Making schema changes | |
| MemtablePostFlusher | Flushing the commit log and other operations after flushing the memtable | |
| StreamStage | Streaming data between nodes during repair | |
| FlushWriter | Flushing the memtable to disk, the status of the sort and write-to-disk operations | Tune hardware or Cassandra configuration. |
| MiscStage | Miscellaneous operations | |
| InternalResponseStage | Responding to non-client initiated messages, including bootstrapping and schema checking | |
| HintedHandoff | Sending missed mutations to other nodes |
DataStax OpsCenter
DataStax OpsCenter is a graphical user interface for monitoring and administering all nodes in a Cassandra cluster from one centralized console. DataStax OpsCenter is bundled with DataStax support offerings. You can register for a free version for development or non-production use.
OpsCenter provides a graphical representation of performance trends in a summary view that is hard to obtain with other monitoring tools. The GUI provides views for different time periods as well as the capability to drill down on single data points. Both real-time and historical performance data for a Cassandra or DataStax Enterprise cluster are available in OpsCenter. OpsCenter metrics are captured and stored within Cassandra.
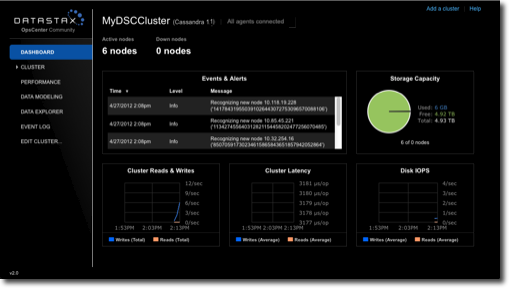
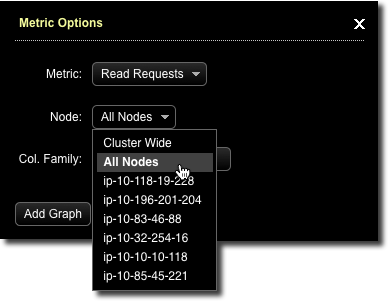
Within OpsCenter you can customize the performance metrics viewed to meet your monitoring needs. Administrators can also perform routine node administration tasks from OpsCenter. Metrics within OpsCenter are divided into three general categories: table metrics, cluster metrics, and OS metrics. For many of the available metrics, you can view aggregated cluster-wide information or view information on a per-node basis.
Monitoring using JConsole
-
Overview
Displays overview information about the Java VM and monitored values.
-
Memory
Displays information about memory use.
-
Threads
Displays information about thread use.
-
Classes
Displays information about class loading.
-
VM Summary
Displays information about the Java Virtual Machine (VM).
-
Mbeans
Displays information about MBeans.
The Overview and Memory tabs contain information that is very useful for Cassandra developers. The Memory tab allows you to compare heap and non-heap memory usage, and provides a control to immediately perform Java garbage collection.
-
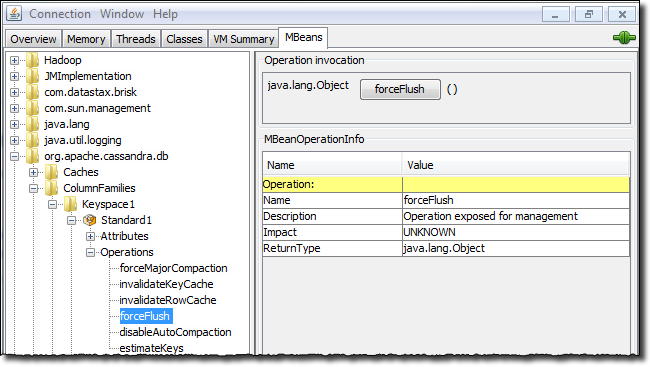
org.apache.cassandra.db
Includes caching, table metrics, and compaction.
-
org.apache.cassandra.internal
Internal server operations such as gossip and hinted handoff.
-
org.apache.cassandra.net
Inter-node communication including FailureDetector, MessagingService and StreamingService.
-
org.apache.cassandra.request
Tasks related to read, write, and replication operations.
When you select an MBean in the tree, its MBeanInfo and MBean Descriptor are displayed on
the right, and any attributes, operations or notifications appear in the tree below it. For
example, selecting and expanding the org.apache.cassandra.db MBean to view available actions
for a table results in a display like the following:
If you choose to monitor Cassandra using JConsole, keep in mind that JConsole consumes a significant amount of system resources. For this reason, DataStax recommends running JConsole on a remote machine rather than on the same host as a Cassandra node.
The JConsole CompactionManagerMBean exposes compaction metrics that can indicate when you need to add capacity to your cluster.