Getting started - quick start with DataStax Studio
Insert data and run traversals.
Graph databases are useful for discovering simple and complex relationships between
objects. Relationships are fundamental to how objects interact with one another and
their environment. Graph databases perfectly represent the relationships between
objects.
Graph databases consist of three elements:
vertex
A vertex is an object, such as a person, location, automobile, recipe,
or anything else you can think of as nouns.
edge
An edge defines the relationship between two vertices. A person can
create software, or an author can write a book. Think verbs when
defining edges.
property
A key-value pair that describes some attribute of either a vertex or an
edge. Property key is used to describe the key in the key-value pair.
All properties are global in DSE Graph, meaning that a property can be
used for any vertices. For example, "name" can be used for all vertices
in a graph.
Vertices, edges and properties can have properties; for this reason, DSE Graph
is classified as a property graph. The properties for elements are an
important element of storing and querying information in a property graph.
Property graphs are typically quite large, although the nature of querying the graph
varies depending on whether the graph has large numbers of vertices, edges, or both
vertices and edges. To get started with graph database concepts, a toy graph
is used for simplicity. The example used here explores the world of food.
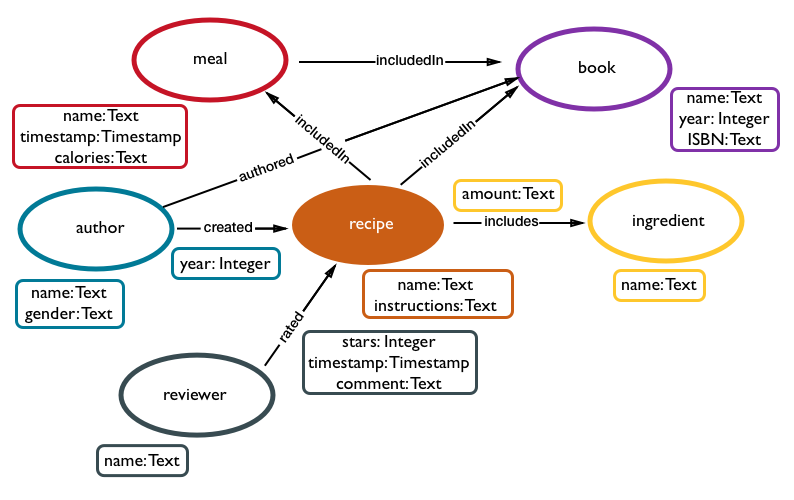
Recipe Toy Graph
Elements are labeled to distinguish the type of vertices and edges in a graph
database using vertex labels and edge labels. A vertex labeled
author holds information about an author. An edge between an
author and a book is labeled authored. Specifying
appropriate labels is an important step in graph data
modeling.
Vertices and edges generally have properties. For instance, an author vertex
can have properties name and gender. Edges can also have properties. A
created edge can have a year property that identifies when the
adjoining recipe vertex was created.
Information in a graph database is retrieved using graph traversals. Graph
traversalswalk a graph with a single or series of traversal steps from a defined
starting point and filter each step until returning a result.
To retrieve information using graph traversals, you must first insert data. The steps
listed in this section allow you to gain a rudimentary understanding of DSE Graph
with a minimum amount of configuration and schema creation.
In DataStax Studio, create a new connection. Choose a
graph name; any graph previously unused will work.
A connection in Studio defines the graph and assigns a graph traversal
g for that graph. A graph traversal is the mechanism for visiting
each vertex in a graph, based on the filters defined in the graph traversal.
To query DSE Graph, the graph traversal g must be assigned to a
particular graph; Studio manages this assignment with connections.
In DataStax Studio, create a new notebook. Select the
connection created in the last step. Each notebook is connected to a particular
graph. Multiple notebooks can be connected to the same graph.
A blank notebook opens with a single cell. DSE Graph runs a Gremlin Server
tinkerpop.server on each DataStax Enterprise node.
DataStax Studio automatically connects to the Gremlin Server, and if it
doesn't exist, it creates a graph using the connection information. The
graph is stored as one graph instance per Cassandra keyspace.
Once a graph exists, a graph traversal g is configured that allows
graph traversals to be executed to query the graph. A graph traversal is
bound to a specific traversal source, which by default is the standard OLTP
traversal engine. The graph commands can add vertices and edges to
the database, or get other graph information. The g commands can
query or add vertices and edges.
First, set the schema mode to Development. Development is a more lenient
mode that allows schema to be added at any time during testing. Also allow full
scans for testing purposes to inspect the data with broad graph traversals. For
production, Production schema mode should be set to prevent interactive
schema changes that can lead to anomalous behavior, and full scans should be
turned off.
To check the number of vertices that exist in the graph, use the traversal step
count(). There should currently be none, because we have
not added data yet. A graph traversal g is chained with V() to
retrieve all vertices and count() to compute the number of vertices.
Chaining executes sequential traversal steps in the most efficient order.
g.V().count()
CAUTION:
Be aware that queries doing full graph scans with
g.V().count() should not be run on large graphs!
If multiple DSE nodes are configured, this traversal step intensively walks
all partitions on all nodes in the cluster that have graph data.
Simple example
Let's start with a simple example from the recipe data model. The data is
composed of two vertices, one author (Julia Child) and one book (The Art of
French Cooking, Vol. 1) with an edge between them to identify that Julia
Child authored that book. Without creating any schema, the three elements can be
created as shown below. However, DSE Graph makes a best guess at the schema, as
we'll talk about below.
First, make a vertex for Julia Child. The vertex label is author and
two property key-value pairs are created for name and gender. Note
that a label designates the key for a key-value pair that sets the vertex label.
Run the command below and look at the results using the buttons to display the
Raw, Table, and Graph views.
auto-generated id, consisting of a member_id, a community_id and a
label
The member_id and the community_id group vertices within
the graph storage structure (see Anatomy of a Graph Traversal)
vertex label
properties, name and gender, and their values
Note: Standard auto-generated ids are
deprecated with DSE 6.0. Custom ids
will undergo changes, and specifying vertex ids with
partitionKey and clusteringKey will likely
become the normal method.
As illustrated in
the next command, a property key can be reused for different types of
information. Properties are global in the sense that they can be used
with multiple vertex labels. However, it is important to understand that you
must specify a vertex label in conjunction with a property in a graph
traversal.
Run the next command to create a book vertex. Be careful not to run any
command twice, or you'll create a duplicate in the graph!
Create a book in the graph:
artOfFrenchCookingVolOne = graph.addVertex(label, 'book','name', 'The Art of French Cooking, Vol. 1', 'year', 1961)
As with the author vertex, you can see all the information about the book
vertex created. In Graph view, use the
Settings button (the gear) to change the display
label for author by entering Chef {{name}}. Change the book
display label with {{label}}:{{name}}.
Run the next two commands. The first command creates the edge between the
author and book vertices. The second command is a graph traversal that retrieves
the two vertices and the edge that connects them. Use Graph
view to see the relationship. Scroll over elements to display
additional information.
Ensure that the data inserted for the author is correct by checking with a
has() step using the vertex label author
and the property name = Julia Child. This graph traversal is a
basic starting point for more complex traversals, because it narrows the search
of the graph with specific information.
g.V().has('author', 'name', 'Julia Child')
Use the Table view to look at the results, as it
is much more readable than the Raw view.
The vertex information is displayed for the author vertex for
Julia Child. A vertex label specifies the type
of vertex, and the key-value pairs identify the property key and its
value for name and gender. The automatically generated
id consists of a vertex label and two components associated with
the location of the vertex within the graph. Anatomy of a Graph Traversal explains
the id components.
Another useful traversal is valueMap(), which prints the
key-value listing of each property value for specified vertices. .
g.V().hasLabel('author').valueMap()
CAUTION:
Using valueMap()
without specifying properties can result in slow query latencies, if a
large number of property keys exist for the queried vertex or edge.
Specific properties can be specified, such as
valueMap('name').
If only the value for a particular property key is desired, use the
values() traversal step. This example gets the
name of all vertices.
g.V().values('name')
Only two vertices exists, so two results are written. If multiple vertices
exist, the traversal step returns results for all vertices that have a
name.
Edge information can also be retrieved. This command filters all edges to find
those with an edge label authored. The edge information
displays details about the incoming and outgoing vertices as well as edge
parameters id, label, and
type.
The traversal step count() is useful for counting both the
number of vertices and edges. To count edges, substitute E()
for V(). You should have one edge.
g.E().count()
Re-running the vertex count traversal done at the beginning of this tutorial
should now yield two vertices.
g.V().count()
Creating schema
Before adding more data to the graph, let's stop
and talk about schema. Schema defines the possible properties and their data
types for the graph. These properties are then used in the definitions of vertex
labels and edge labels. The last critical step in schema creation is index
creation. Indexes play an important role in making graph traversals efficient
and fast. See Creating graph schema using Studio and Indexing graph data for more information.
First, let's create schema for the property keys.
In the next two cells, the first command clears the schema for the previously
created vertices and edge. After the schema creation is completed, the next step
is to enter data for those elements again in a longer script.
Note: DSE Graph
has two schema modes, Production and Development. In Production mode, all schema
must be identified before data is entered. In Development mode, schema can be
created after data is entered.
Create the new schema:
Clear the schema:
schema.clear()
Create the new property key schema:
// Property Keys
// Check for previous creation of property key with ifNotExists()
schema.propertyKey('name').Text().ifNotExists().create()
schema.propertyKey('gender').Text().create()
schema.propertyKey('instructions').Text().create()
schema.propertyKey('category').Text().create()
schema.propertyKey('year').Int().create()
schema.propertyKey('timestamp').Timestamp().create()
schema.propertyKey('ISBN').Text().create()
schema.propertyKey('calories').Int().create()
schema.propertyKey('amount').Text().create()
schema.propertyKey('stars').Int().create()
// single() is optional, as it is the default
schema.propertyKey('comment').Text().single().create()
// Example of a multiple property that can have several values
// schema.propertyKey('nickname').Text().multiple().create() // Next 2 lines define two properties, then create a meta-property 'livedIn' on 'country'
// A meta-property is a property of a property
// EX: 'livedIn': '1999-2005' 'country': 'Belgium'
schema.propertyKey('livedIn').Text().create()
schema.propertyKey('country').Text().multiple().properties('livedIn').create()
Each property must be defined with a data type. DSE Graph data
types are aligned with Cassandra data types. The data types used
here are Text, Int, and Timestamp. By default, properties have
single cardinality, but can be defined with multiple cardinality. Multiple cardinality allows more
than one value to be assigned to a property.
In addition, properties can have their own properties, or
meta-properties. Meta-properties can only be nested one
deep, and are useful for keying information to an individual
property. Notice that property keys can be created with an
additional method ifNotExists(). This method
prevents overwriting a definition that can already exist. After
property keys are created, vertex labels and edge labels can be
defined.
Create the schema for vertex labels and edge labels:
// Vertex Labels
schema.vertexLabel('author').ifNotExists().create()
schema.vertexLabel('recipe').create()
// Example of creating vertex label with properties
// schema.vertexLabel('recipe').properties('name','instructions').create()
// Example of adding properties to a previously created vertex label
// schema.vertexLabel('recipe').properties('name','instructions').add()
schema.vertexLabel('ingredient').create()
schema.vertexLabel('book').create()
schema.vertexLabel('meal').create()
schema.vertexLabel('reviewer').create()
// Example of custom vertex id:
// schema.propertyKey('city_id').Int().create()
// schema.propertyKey('sensor_id').Uuid().create()
// schema().vertexLabel('FridgeSensor').partitionKey('city_id').clusteringKey('sensor_id').create()

// Edge Labels
schema.edgeLabel('authored').ifNotExists().create()
schema.edgeLabel('created').create()
schema.edgeLabel('includes').create()
schema.edgeLabel('includedIn').create()
schema.edgeLabel('rated').connection('reviewer','recipe').create()
The schema for vertex labels defines the label type, and optionally
defines the properties associated with the vertex label. Two methods exist
for defining the association of the properties with vertex labels, either
during creation or by adding them after vertex label addition. You can use
the ifNotExists() for any schema creation.
DSE Graph limits the number of vertex labels to 200 per graph.
Vertex ids are automatically generated, but custom vertex ids can be
created if necessary. The custom vertex id example shown here defines a
partition key and a clustering key.
The schema for edge labels defines the label type, and optionally
defines the two vertex labels that are connected by the edge label with
connection(). The rated edge label
defines edges between adjacent vertices with the outgoing vertex label
reviewer and the incoming vertex label
recipe. By default, edges have multiple cardinality, but can be
defined with single cardinality. Multiple cardinality allows more than one
edge with differing property values but the same edge label to be
assigned.
Create the index schema:
// Vertex Indexes
// Secondary
schema.vertexLabel('author').index('byName').secondary().by('name').add()
// Materialized
schema.vertexLabel('recipe').index('byRecipe').materialized().by('name').add()
schema.vertexLabel('meal').index('byMeal').materialized().by('name').add()
schema.vertexLabel('ingredient').index('byIngredient').materialized().by('name').add()
schema.vertexLabel('reviewer').index('byReviewer').materialized().by('name').add()
// Search
// schema.vertexLabel('recipe').index('search').search().by('instructions').asText().add()
// schema.vertexLabel('recipe').index('search').search().by('instructions').asString().add()
// If more than one property key is search indexed
// schema.vertexLabel('recipe').index('search').search().by('instructions').asText().by('category').asString().add()

// Property index using meta-property 'livedIn':
schema.vertexLabel('author').index('byLocation').property('country').by('livedIn').add()

// Edge Index
schema.vertexLabel('reviewer').index('ratedByStars').outE('rated').by('stars').add()
Indexing is a complex and highly
important subject. Here, several types of indexes are created. Briefly,
secondary and materialized indexes are two types of indexes that use
Cassandra built-in indexing. Search indexes use DSE Search which is
Solr-based. Only one search index per vertex label is allowed, but multiple
properties can be included. Property indexes allow meta-properties indexed.
Edge indexes allow properties on edges to be indexed. Note that indexes are
added with add() to previously created vertex labels.
Examine the schema:
schema.describe()
The schema.describe() command displays schema you can use to
recreate the schema entered. If you enter data without creating schema, you
can use this command verify the data types set for each property.
Currently, in DSE Graph, schema once created cannot be modified. Additional
properties, vertex labels, edge labels, and indexes can be created, but the
data type of a property, for instance, cannot be changed. While entering
data without schema creation is useful while developing and learning, it is
strongly recommended against for actual applications. As a reminder,
Production mode disallows schema creation once data is loaded.
To find only the schema for a particular type of item in the
describe() listing, use the following command:
schema.describe().split('\n').grep(~/.*index.*/)
Additional steps can split the output per newline and grep for a string as
shown for index. The Gremlin variant used here is based on
Apache Groovy, so any Groovy commands can be used to manipulate
graph traversals. Apache Groovy is a language that smoothly integrates with
Java to provide scripting capabilities.
Adding more data
Now that schema is created, add more vertices and edges using the following
script o explore more connections in the recipe data model. Enter the following
lines in a single DataStax Studio cell and execute. Notice that the first
command, g.V().drop().iterate() drop all vertex and edge data
before reading in new data. Be sure to select the Graph
view after running the script.
// generateRecipe.groovy

// Add all vertices and edges for Recipe
g.V().drop().iterate()

// author vertices
juliaChild = graph.addVertex(label, 'author', 'name','Julia Child', 'gender', 'F')
simoneBeck = graph.addVertex(label, 'author', 'name', 'Simone Beck', 'gender', 'F')
louisetteBertholie = graph.addVertex(label, 'author', 'name', 'Louisette Bertholie', 'gender', 'F')
patriciaSimon = graph.addVertex(label, 'author', 'name', 'Patricia Simon', 'gender', 'F')
aliceWaters = graph.addVertex(label, 'author', 'name', 'Alice Waters', 'gender', 'F')
patriciaCurtan = graph.addVertex(label, 'author', 'name', 'Patricia Curtan', 'gender', 'F')
kelsieKerr = graph.addVertex(label, 'author', 'name', 'Kelsie Kerr', 'gender', 'F')
fritzStreiff = graph.addVertex(label, 'author', 'name', 'Fritz Streiff', 'gender', 'M')
emerilLagasse = graph.addVertex(label, 'author', 'name', 'Emeril Lagasse', 'gender', 'M')
jamesBeard = graph.addVertex(label, 'author', 'name', 'James Beard', 'gender', 'M')

// book vertices
artOfFrenchCookingVolOne = graph.addVertex(label, 'book', 'name', 'The Art of French Cooking, Vol. 1', 'year', 1961)
simcasCuisine = graph.addVertex(label, 'book', 'name', "Simca's Cuisine: 100 Classic French Recipes for Every Occasion", 'year', 1972, 'ISBN', '0-394-40152-2')
frenchChefCookbook = graph.addVertex(label, 'book', 'name','The French Chef Cookbook', 'year', 1968, 'ISBN', '0-394-40135-2')
artOfSimpleFood = graph.addVertex(label, 'book', 'name', 'The Art of Simple Food: Notes, Lessons, and Recipes from a Delicious Revolution', 'year', 2007, 'ISBN', '0-307-33679-4')

// recipe vertices
beefBourguignon = graph.addVertex(label, 'recipe', 'name', 'Beef Bourguignon', 'instructions', 'Braise the beef. Saute the onions and carrots. Add wine and cook in a dutch oven at 425 degrees for 1 hour.')
ratatouille = graph.addVertex(label, 'recipe', 'name', 'Rataouille', 'instructions', 'Peel and cut the eggplant. Make sure you cut eggplant into lengthwise slices that are about 1-inch wide, 3-inches long, and 3/8-inch thick')
saladeNicoise = graph.addVertex(label, 'recipe', 'name', 'Salade Nicoise', 'instructions', 'Take a salad bowl or platter and line it with lettuce leaves, shortly before serving. Drizzle some olive oil on the leaves and dust them with salt.')
wildMushroomStroganoff = graph.addVertex(label, 'recipe', 'name', 'Wild Mushroom Stroganoff', 'instructions', 'Cook the egg noodles according to the package directions and keep warm. Heat 1 1/2 tablespoons of the olive oil in a large saute pan over medium-high heat.')
spicyMeatloaf = graph.addVertex(label, 'recipe', 'name', 'Spicy Meatloaf', 'instructions', 'Preheat the oven to 375 degrees F. Cook bacon in a large skillet over medium heat until very crisp and fat has rendered, 8-10 minutes.')
oystersRockefeller = graph.addVertex(label, 'recipe', 'name', 'Oysters Rockefeller', 'instructions', 'Saute the shallots, celery, herbs, and seasonings in 3 tablespoons of the butter for 3 minutes. Add the watercress and let it wilt.')
carrotSoup = graph.addVertex(label, 'recipe', 'name', 'Carrot Soup', 'instructions', 'In a heavy-bottomed pot, melt the butter. When it starts to foam, add the onions and thyme and cook over medium-low heat until tender, about 10 minutes.')
roastPorkLoin = graph.addVertex(label, 'recipe', 'name', 'Roast Pork Loin', 'instructions', 'The day before, separate the meat from the ribs, stopping about 1 inch before the end of the bones. Season the pork liberally inside and out with salt and pepper and refrigerate overnight.')

// ingredients vertices
beef = graph.addVertex(label, 'ingredient', 'name', 'beef')
onion = graph.addVertex(label, 'ingredient', 'name', 'onion')
mashedGarlic = graph.addVertex(label, 'ingredient', 'name', 'mashed garlic')
butter = graph.addVertex(label, 'ingredient', 'name', 'butter')
tomatoPaste = graph.addVertex(label, 'ingredient', 'name', 'tomato paste')
eggplant = graph.addVertex(label, 'ingredient', 'name', 'eggplant')
zucchini = graph.addVertex(label, 'ingredient', 'name', 'zucchini')
oliveOil = graph.addVertex(label, 'ingredient', 'name', 'olive oil')
yellowOnion = graph.addVertex(label, 'ingredient', 'name', 'yellow onion')
greenBean = graph.addVertex(label, 'ingredient', 'name', 'green beans')
tuna = graph.addVertex(label, 'ingredient', 'name', 'tuna')
tomato = graph.addVertex(label, 'ingredient', 'name', 'tomato')
hardBoiledEgg = graph.addVertex(label, 'ingredient', 'name', 'hard-boiled egg')
eggNoodles = graph.addVertex(label, 'ingredient', 'name', 'egg noodles')
mushroom = graph.addVertex(label, 'ingredient', 'name', 'mushrooms')
bacon = graph.addVertex(label, 'ingredient', 'name', 'bacon')
celery = graph.addVertex(label, 'ingredient', 'name', 'celery')
greenBellPepper = graph.addVertex(label, 'ingredient', 'name', 'green bell pepper')
groundBeef = graph.addVertex(label, 'ingredient', 'name', 'ground beef')
porkSausage = graph.addVertex(label, 'ingredient', 'name', 'pork sausage')
shallot = graph.addVertex(label, 'ingredient', 'name', 'shallots')
chervil = graph.addVertex(label, 'ingredient', 'name', 'chervil')
fennel = graph.addVertex(label, 'ingredient', 'name', 'fennel')
parsley = graph.addVertex(label, 'ingredient', 'name', 'parsley')
oyster = graph.addVertex(label, 'ingredient', 'name', 'oyster')
pernod = graph.addVertex(label, 'ingredient', 'name', 'Pernod')
thyme = graph.addVertex(label, 'ingredient', 'name', 'thyme')
carrot = graph.addVertex(label, 'ingredient', 'name', 'carrots')
chickenBroth = graph.addVertex(label, 'ingredient', 'name', 'chicken broth')
porkLoin = graph.addVertex(label, 'ingredient', 'name', 'pork loin')
redWine = graph.addVertex(label, 'ingredient', 'name', 'red wine')

// meal vertices
// timestamp can also be entered as '2015-01-01' without Instant.parse()
SaturdayFeast = graph.addVertex(label, 'meal', 'name', 'Saturday Feast', 'timestamp', '2015-11-30', 'calories', 1000)
EverydayDinner = graph.addVertex(label, 'meal', 'name', 'EverydayDinner', 'timestamp', '2016-01-14', 'calories', 600)
JuliaDinner = graph.addVertex(label, 'meal', 'name', 'JuliaDinner', 'timestamp', '2016-01-14', 'calories', 900)

// author-book edges
juliaChild.addEdge('authored', artOfFrenchCookingVolOne)
simoneBeck.addEdge('authored', artOfFrenchCookingVolOne)
louisetteBertholie.addEdge('authored', artOfFrenchCookingVolOne)
simoneBeck.addEdge('authored', simcasCuisine)
patriciaSimon.addEdge('authored', simcasCuisine)
juliaChild.addEdge('authored', frenchChefCookbook)
aliceWaters.addEdge('authored', artOfSimpleFood)
patriciaCurtan.addEdge('authored', artOfSimpleFood)
kelsieKerr.addEdge('authored', artOfSimpleFood)
fritzStreiff.addEdge('authored', artOfSimpleFood)

// author - recipe edges
juliaChild.addEdge('created', beefBourguignon, 'year', 1961)
juliaChild.addEdge('created', ratatouille, 'year', 1965)
juliaChild.addEdge('created', saladeNicoise, 'year', 1962)
emerilLagasse.addEdge('created', wildMushroomStroganoff, 'year', 2003)
emerilLagasse.addEdge('created', spicyMeatloaf, 'year', 2000)
aliceWaters.addEdge('created', carrotSoup, 'year', 1995)
aliceWaters.addEdge('created', roastPorkLoin, 'year', 1996)
jamesBeard.addEdge('created', oystersRockefeller, 'year', 1970)

// recipe - ingredient edges
beefBourguignon.addEdge('includes', beef, 'amount', '2 lbs')
beefBourguignon.addEdge('includes', onion, 'amount', '1 sliced')
beefBourguignon.addEdge('includes', mashedGarlic, 'amount', '2 cloves')
beefBourguignon.addEdge('includes', butter, 'amount', '3.5 Tbsp')
beefBourguignon.addEdge('includes', tomatoPaste, 'amount', '1 Tbsp')
ratatouille.addEdge('includes', eggplant, 'amount', '1 lb')
ratatouille.addEdge('includes', zucchini, 'amount', '1 lb')
ratatouille.addEdge('includes', mashedGarlic, 'amount', '2 cloves')
ratatouille.addEdge('includes', oliveOil, 'amount', '4-6 Tbsp')
ratatouille.addEdge('includes', yellowOnion, 'amount', '1 1/2 cups or 1/2 lb thinly sliced')
saladeNicoise.addEdge('includes', oliveOil, 'amount', '2-3 Tbsp')
saladeNicoise.addEdge('includes', greenBean, 'amount', '1 1/2 lbs blanched, trimmed')
saladeNicoise.addEdge('includes', tuna, 'amount', '8-10 ozs oil-packed, drained and flaked')
saladeNicoise.addEdge('includes', tomato, 'amount', '3 or 4 red, peeled, quartered, cored, and seasoned')
saladeNicoise.addEdge('includes', hardBoiledEgg, 'amount', '8 halved lengthwise')
wildMushroomStroganoff.addEdge('includes', eggNoodles, 'amount', '16 ozs wmyIde')
wildMushroomStroganoff.addEdge('includes', mushroom, 'amount', '2 lbs wild or exotic, cleaned, stemmed, and sliced')
wildMushroomStroganoff.addEdge('includes', yellowOnion, 'amount', '1 cup thinly sliced')
spicyMeatloaf.addEdge('includes', bacon, 'amount', '3 ozs diced')
spicyMeatloaf.addEdge('includes', onion, 'amount', '2 cups finely chopped')
spicyMeatloaf.addEdge('includes', celery, 'amount', '2 cups finely chopped')
spicyMeatloaf.addEdge('includes', greenBellPepper, 'amount', '1/4 cup finely chopped')
spicyMeatloaf.addEdge('includes', porkSausage, 'amount', '3/4 lbs hot')
spicyMeatloaf.addEdge('includes', groundBeef, 'amount', '1 1/2 lbs chuck')
oystersRockefeller.addEdge('includes', shallot, 'amount', '1/4 cup chopped')
oystersRockefeller.addEdge('includes', celery, 'amount', '1/4 cup chopped')
oystersRockefeller.addEdge('includes', chervil, 'amount', '1 tsp')
oystersRockefeller.addEdge('includes', fennel, 'amount', '1/3 cup chopped')
oystersRockefeller.addEdge('includes', parsley, 'amount', '1/3 cup chopped')
oystersRockefeller.addEdge('includes', oyster, 'amount', '2 dozen on the half shell')
oystersRockefeller.addEdge('includes', pernod, 'amount', '1/3 cup')
carrotSoup.addEdge('includes', butter, 'amount', '4 Tbsp')
carrotSoup.addEdge('includes', onion, 'amount', '2 medium sliced')
carrotSoup.addEdge('includes', thyme, 'amount', '1 sprig')
carrotSoup.addEdge('includes', carrot, 'amount', '2 1/2 lbs, peeled and sliced')
carrotSoup.addEdge('includes', chickenBroth, 'amount', '6 cups')
roastPorkLoin.addEdge('includes', porkLoin, 'amount', '1 bone-in, 4-rib')
roastPorkLoin.addEdge('includes', redWine, 'amount', '1/2 cup')
roastPorkLoin.addEdge('includes', chickenBroth, 'amount', '1 cup')

// book - recipe edges
beefBourguignon.addEdge('includedIn', artOfFrenchCookingVolOne)
saladeNicoise.addEdge('includedIn', artOfFrenchCookingVolOne)
carrotSoup.addEdge('includedIn', artOfSimpleFood)

// meal - recipe edges
beefBourguignon.addEdge('includedIn', SaturdayFeast)
carrotSoup.addEdge('includedIn', SaturdayFeast)
oystersRockefeller.addEdge('includedIn', SaturdayFeast)
carrotSoup.addEdge('includedIn', EverydayDinner)
roastPorkLoin.addEdge('includedIn', EverydayDinner)
beefBourguignon.addEdge('includedIn', JuliaDinner)
saladeNicoise.addEdge('includedIn', JuliaDinner)

// meal - book edges
EverydayDinner.addEdge('includedIn', artOfSimpleFood)
SaturdayFeast.addEdge('includedIn', simcasCuisine)
JuliaDinner.addEdge('includedIn', artOfFrenchCookingVolOne)
g.V()
Data for the Recipe Toy Graph
The property timestamp is a Timestamp data
type that corresponds to a valid Cassandra timestamp data type.
The g.V() command at the end of the script displays all the
vertices created.
If a vertex count is run, there is now a higher count of 56 vertices. Run the
vertex count again:
g.V().count()
The DSE Graph Loader is
available for scripting data loading. It is the recommended method for data
loading.
Exploring the graph with graph traversals can lead to interesting
conclusions.
With several author vertices in the graph, to find a particular vertex,
provide a specific name. This traversal gets the stored vertex
information for the vertex that has the name
of Julia Child. Note that the traversal is also constrained by
an authorvertex in the has clause.
g.V().has('author','name','Julia Child')
In this next traversal, has() gets the vertex information
filtered by name = Julia Child. The traversal step
outE() discovers the outgoing edges from that vertex with
the authored label.
g.V().has('name','Julia Child').outE('authored')
In DataStax Studio, either the listing of the Raw view
edge information:
or the Graph view graph visualization where scrolling
over a vertex provides additional information.
If instead, you want to query for the books that all authors have written, the
query must be modified. The previous example retrieved edges, but not the
adjacent book vertices. Add a traversal step inV() to find all
the vertices that connect to the outgoing edges, then print the book titles of
those vertices. Notice how the chained traversal steps go from the vertices
along outgoing edges to the adjacent vertices with
V().outE().inV(). The outgoing edges are given a particular
filter value, authored.
g.V().outE('authored').inV().values('name')
Notice that the book titles are duplicated in the resulting list, because a
listing is returned for each author. If a book has three authors, three listings
are returned. The traversal step dedup() can eliminate the
duplication.
The previous example and this example accomplish the same result. However, the
number of traversal steps and the type of traversal steps can affect
performance. The traversal step outE() should be only used if
the edges are explicitly required. In this example, the edges are traversed to
get information about connected vertices, but the edge information is not
important to the query.
The traversal step out() retrieves the connected book
vertices based on the edge label authored without
retrieving the edge information. In a larger graph traversal, this subtle
difference in the traversal can become a latency issue.
Additional traversal steps continue to fine-tune the results. Adding another
chained has traversal step finds only books authored by Julia
Child published after 1967. This example also displays the use of the
gt, or greater than function.
When developing or testing, often checking the number of vertices with each
vertex label can confirm that data was read. To find the number of vertices by
vertex label, use the traversal step label() followed by the
traversal step groupCount(). The step
groupCount() is useful for aggregating results from a
previous step.
g.V().label().groupCount()
Write your data to an output file to save or exchange information. A Gryo file
is a binary format file that can reload data to DSE Graph. In this next command,
graph I/O writes the entire graph to a file. Other file formats can be written
by substituting gryo() with graphml() or
graphson().
graph.io(gryo()).writeGraph("/tmp/recipe.gryo")
Note:graph.io() is disabled in sandbox
mode.
To load a Gryo file, use the graphloader, after creating a
mapping script:
If you wish to use the gremlin console after working in Studio, two commands
are useful: system.graphs() to get a list of all graphs and :remote config alias g
some_graph.g to switch to a different graph.
What's next
Congratulations! You are well on your way to using DSE Graph for data
discovery.
 CAUTION:Be aware that queries doing full graph scans with
 Each view displays the same information:


 CAUTION:Using


