Graph data modeling example
Details of a larger data model creation.
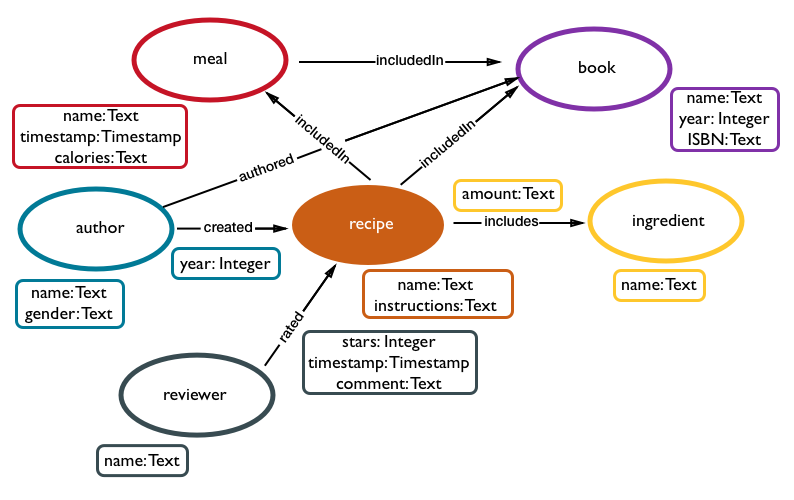
Let's consider the example of recipes further to create a more complex data model. This example will go through some of the thinking behind creating a graph database data model.
Procedure
-
Obviously, we will need vertices that are connected by edges. What is a
possible additional type of vertex besides author and recipe?
Not surprisingly, we can add an ingredient vertex label. This vertex will have some properties. Can you think of the possibilities for vertex properties?
The most likely property for an ingredient vertex is the name of the ingredient. While we could use
ingredientNameto identify the name of the ingredient, keeping the schema small has advantages in DSE Graph. We'll reusenamefor every vertex label in our example.
-
There are other possibilities that might be important for the ingredient vertex
properties. Think about it and write down some more possibilities. We will add
them later. Let's move on to considering the edges that will connect
authors, recipes, and ingredients.
What are the edge labels we can use to identify different types of edges? Previously, you've seen that authors and recipe are connected by an edge created.
An ingredient must be included in a recipe, so an edge includes can connect the two vertices.

-
Edges also have attached properties that can be used later in narrowing
queries.
What edge property is appropriate for includes?

The amount of ingredient included in a recipe is important! One cup of salt instead of one teaspoon of salt will make a big difference in the results.
-
Today, people publish their recipes online and in cookbooks. Restaurants create
fixed price meals from recipes. Consumers review the recipes they try. The
results are an intertwined graph of data.
-
The additional vertices and edges that can be added to this graph are numerous.
For instance, the gender of the recipe authors and reviewers can be included.
Nutritional information for the ingredients can be derived from the calories for
a recipe. The number of servings that a recipe makes is useful to cooks. The
resulting web of data can grow quickly.

Add a hundred authors, a thousand recipes, ten thousand reviews, and the enormity of the graph becomes obvious. However, as you will see in later sections, DSE Graph can transform complex searches and pattern matching into simple and powerful solutions.
What's next
The data model is the first step in creating a graph. Using the data model, a schema can be created that defines how DSE Graph will store the data.