Troubleshooting
Check quotas
In some cases, pods can become unhealthy. The root cause might be an insufficient quota. You can check quotas in the cloud provider’s user interface.
For example, in the Google Cloud (GCP) console, check for any unhealthy pods in your GKE project. Then in the IAM & Admin section of the GCP console, navigate to Quotas. Look for any reported issues with backend services:
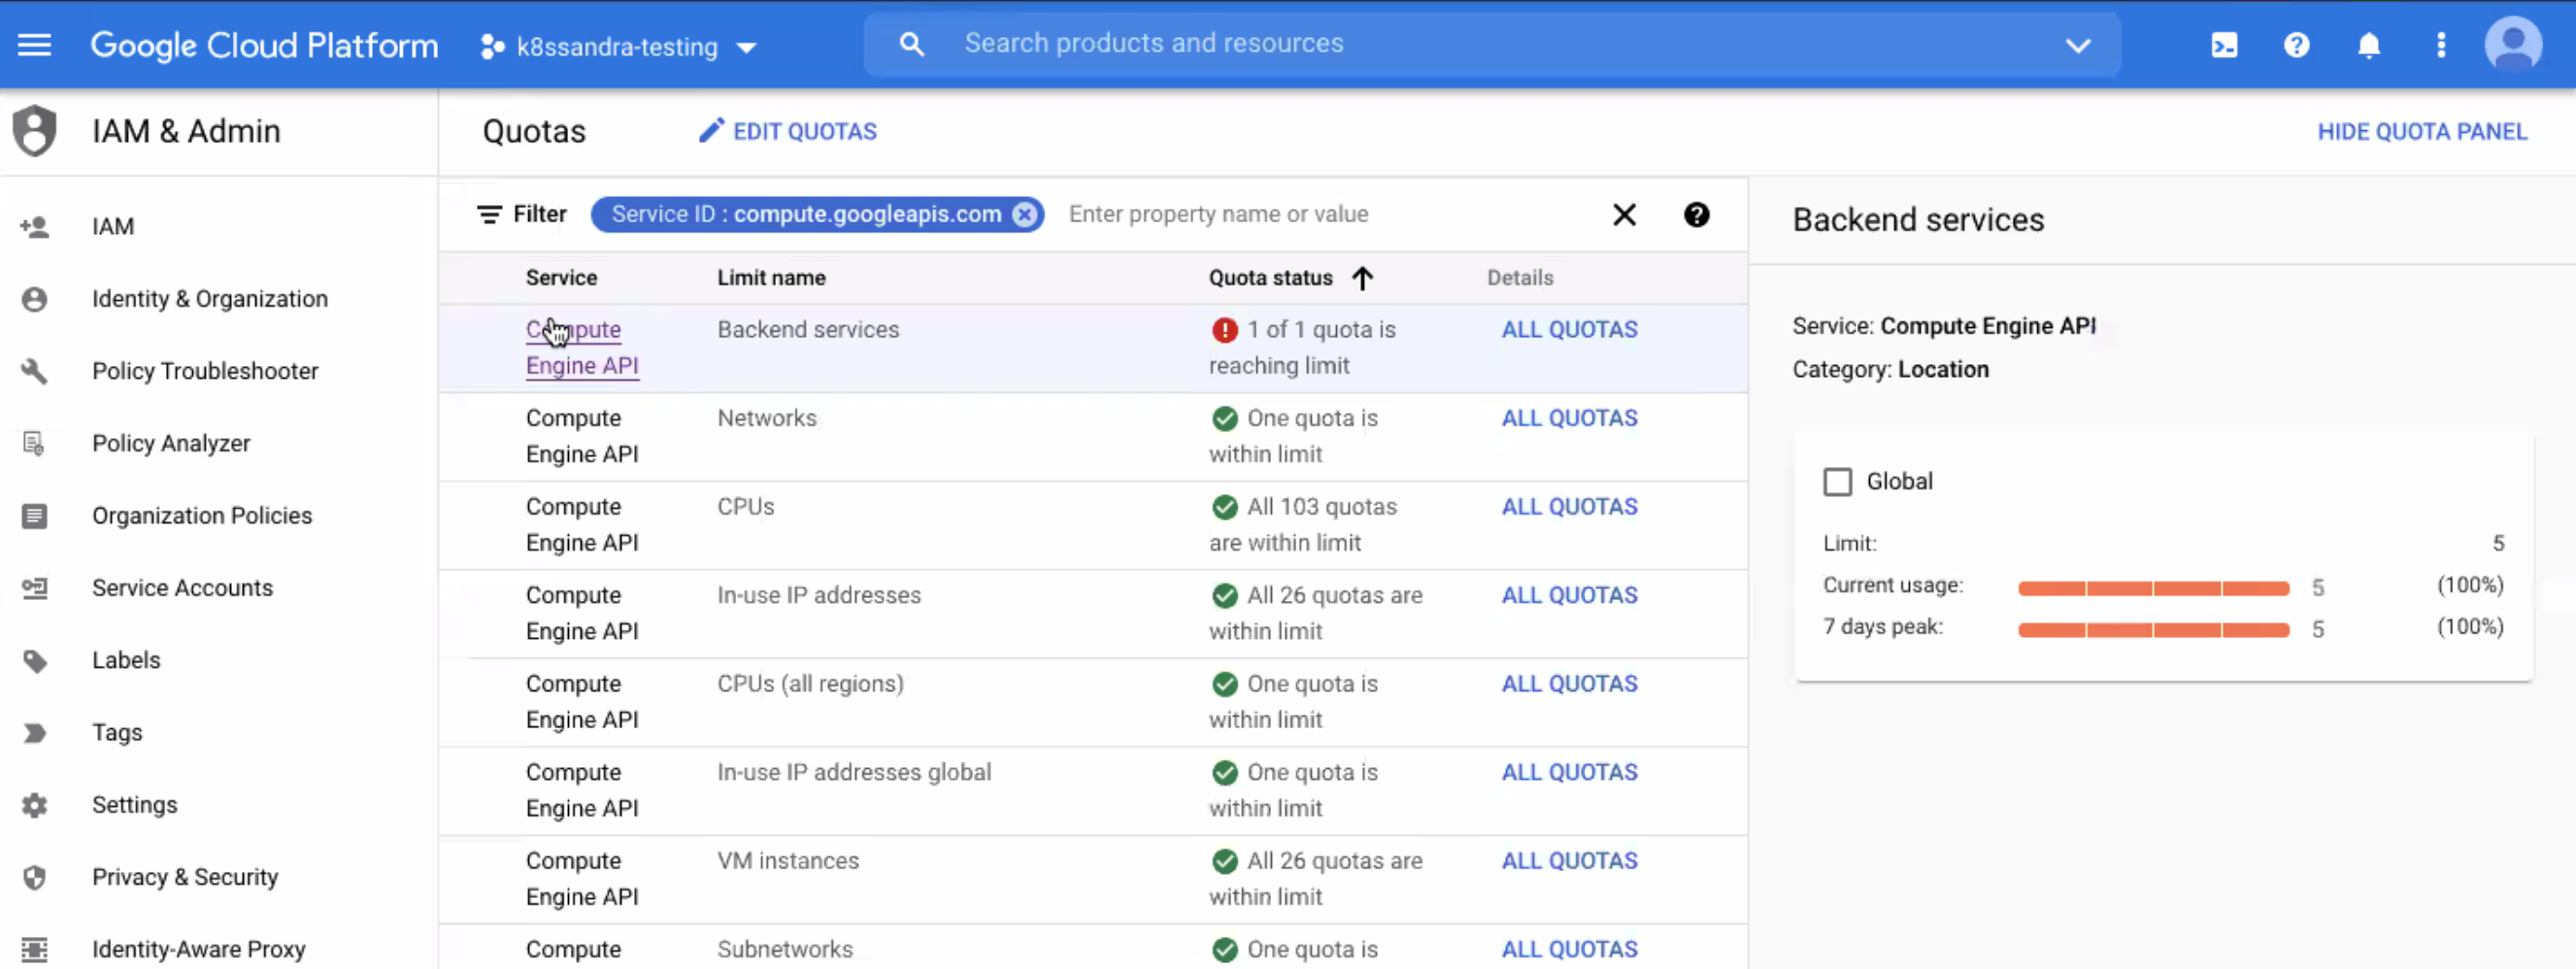
From the GCP Console Quotas page:
-
Select the row for the service name that is reporting a quota issue.
-
Select All Quotas from the Details column.
-
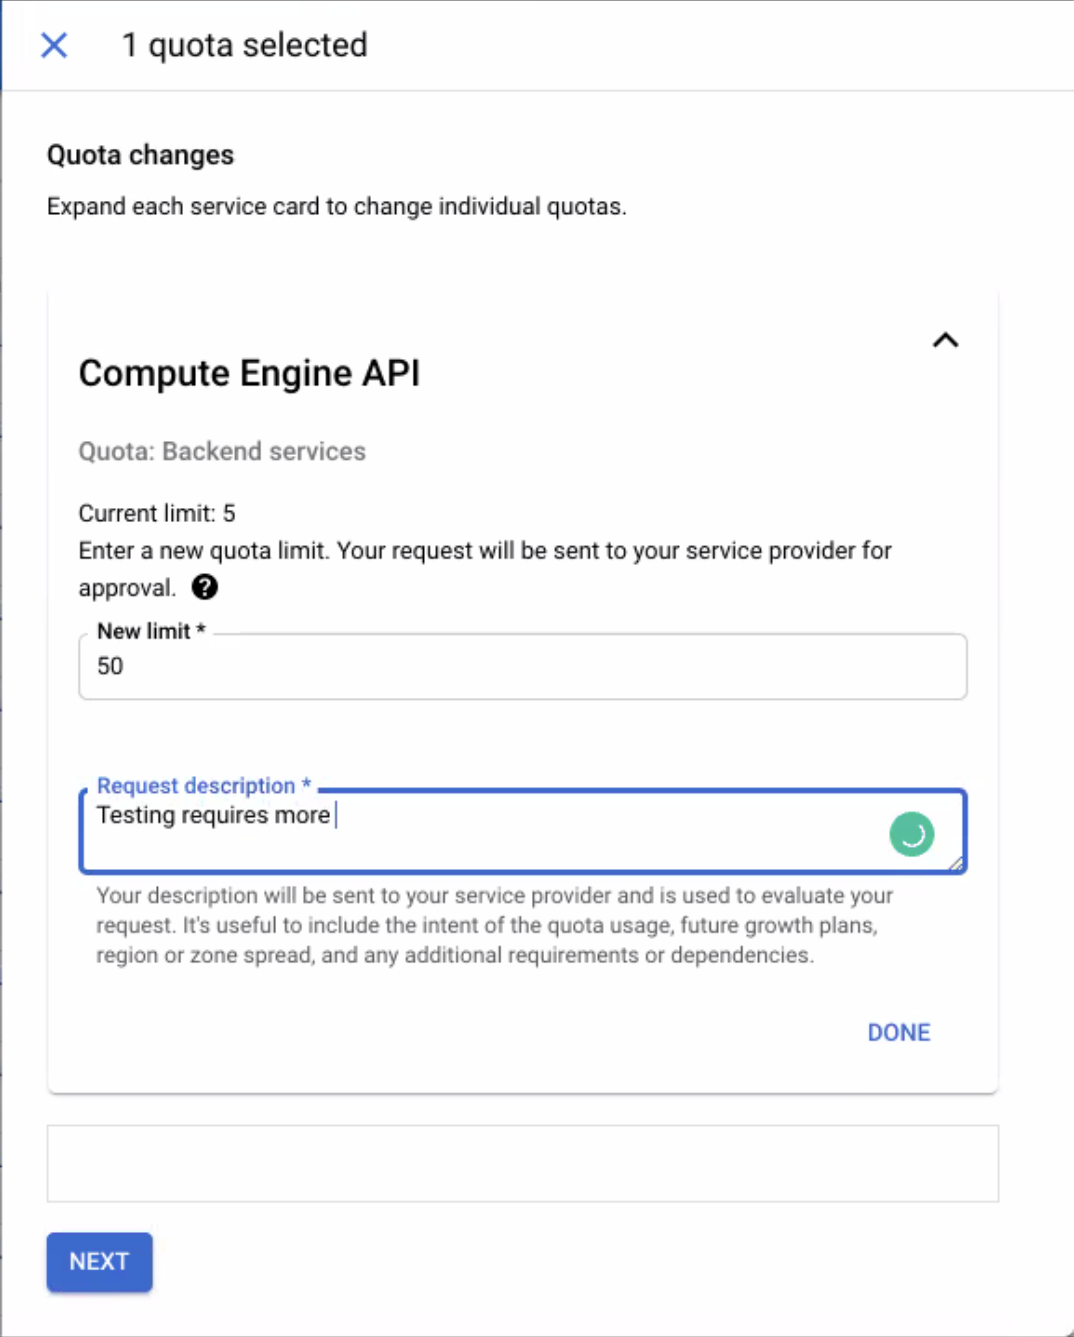
Check the box for the affected quota, and select Edit Quota.
-
Examine the displayed current value, and then set a new value.
-
Enter a brief request description, and then select Next.
-
Verify your contact information, and then select Submit Request.
In the following example, the Backend services quota is set to '5', and the requested limit is '50'.
For K8ssandra deployments, such as Stargate, cass-operator, Reaper, and Medusa, 10 might be a sufficient quota.
Containers in Pending state
If your pods are stuck in a Pending state after installation or your cloud provider is warning you about Unschedulable Pods, there are a few ways to work through this:
-
If some of your pods start, but others like
pulsar-adminconsoleandpulsar-grafanaare left in an Unschedulable state, you might need to add CPUs to your existing nodes or an additional node pool. IBM Elite Support for Apache Pulsar requires more resources than Apache Pulsar. -
To examine a specific pod, use
kubectl describe. For example, if yourpulsar-bookkeeper-0pod is not scheduling, usekubectl describe pods/pulsar-bookkeeper-0to view detailed output on the pod’s state, dependencies, and events. -
To view log output for a specific pod, use
kubectl logs. Continuing with thepulsar-bookkeeper-0example, to get logs for this pod usekubectl logs pulsar-bookkeeper-0. If this pod spans multiple containers, add the flag--all-containers=true.
Bastion pod
The bastion pod deploys with IBM Elite Support for Apache Pulsar and allows a user to execute administrative commands in a bash shell of the cluster. This can be a helpful troubleshooting tool for testing the health of your cluster.
Access bastion pod
To use the bastion pod after installation, access the shell of the bastion pod.
This example uses the namespace default:
kubectl -n default exec $(kubectl get pods --namespace default -l "app=pulsar,component=bastion" -o jsonpath="{.items[0].metadata.name}") -it -- bashYour terminal shows that you are in your bastion pod:
pulsar@pulsar-bastion-78d4cd74ff-ctvvh:/pulsar$Test bastion pod
To verify that your bastion pod sees your cluster, run pulsar admin namespaces list public.
It should return a list of your public namespaces:
"public/default"
"public/functions"
If you get bash: admin: command not found, change to the bin directory (cd bin).
You might need to append your command with ./, such as ./pulsar-admin get pods.
If the shell finds no resources, you might not have any public namespaces.
To create a public namespace, run pulsar-admin namespaces create public/default.
Publish a message
To test your Pulsar cluster with the bastion pod, produce a message with pulsar-client through the bastion pod shell:
pulsar-client produce my-test-topic --messages "hello-pulsar"You should receive a confirmation that the message was produced:
00:16:37.970 [main] INFO org.apache.pulsar.client.cli.PulsarClientTool - 1 messages successfully producedThis means your Pulsar cluster is functional. If the message isn’t produced, double-check your message syntax.
Next steps
To view your cluster, brokers, and connectors in a user interface, see the Admin Console Tutorial.
