Scrape Astra Streaming metrics with Prometheus
Prometheus collects system metrics by scraping targets at intervals. These metrics are used to monitor deployments, generate alerts, and diagnose problems.
This doc will show you how to scrape an Astra Streaming tenant with Prometheus.
Prerequisites
-
Astra Streaming tenant
-
Docker installed locally
Get the configuration file from Astra Streaming
-
In the Astra Portal header, click Applications, and then select Streaming.
-
Click the name of your tenant, and then click the Connect tab.
-
Click Prometheus to generate a new configuration file:
prometheus.ymlglobal: scrape_interval: 60s evaluation_interval: 60s scrape_configs: - job_name: "astra-pulsar-metrics" scheme: 'https' metrics_path: '/pulsarmetrics/TENANT_NAME' authorization: credentials: 'PULSAR_TOKEN' static_configs: - targets: [https://prometheus-PROVIDER-REGION.streaming.datastax.com/pulsarmetrics/TENANT_NAME]The default
prometheus.ymlscrapes thetargettenant every 60 seconds, and it uses the specifiedPULSAR_TOKENfor authentication. Thejob_nameis added as a label to any timeseries scraped with this configuration. -
Copy the configuration YAML or download the
prometheus.ymlfile.
Build Prometheus
Prometheus runs with a prometheus.yml file available locally or in a Docker container.
This example uses Docker.
-
Pull the Prometheus Docker image:
docker pull prom/prometheus -
Bind-mount your modified
prometheus.ymlfile by running the Prometheus Docker container with a modified path in the-vargument:docker run \ -p 9090:9090 \ -v /**PATH_TO_PROMETHEUS_YAML**:/etc/prometheus/prometheus.yml \ prom/prometheus -
Make sure the response is similar to the following example. This indicates that Prometheus is ready to scrape your Astra Streaming tenant:
ts=2022-05-10T20:40:30.877Z caller=main.go:1199 level=info msg="Completed loading of configuration file" filename=/etc/prometheus/prometheus.yml totalDuration=2.75025ms db_storage=584ns remote_storage=708ns web_handler=167ns query_engine=416ns scrape=262.125µs scrape_sd=12.208µs notify=667ns notify_sd=792ns rules=1.042µs tracing=2.959µs
ts=2022-05-10T20:40:30.877Z caller=main.go:930 level=info msg="Server is ready to receive web requests."
If you get a
mounts deniedpermissions error, make sure your local directory is shared with Docker. In Docker Desktop, click File Sharing, click Resources, and then make sure your local directory is listed.
Scrape with Prometheus
-
Navigate to your Prometheus dashboard at
localhost:9090. -
Click Status, select Targets, and then make sure your
status_config.targetsendpoint’s status is UP. -
Navigate to
http://localhost:9090/graph, and click the Graph tab. -
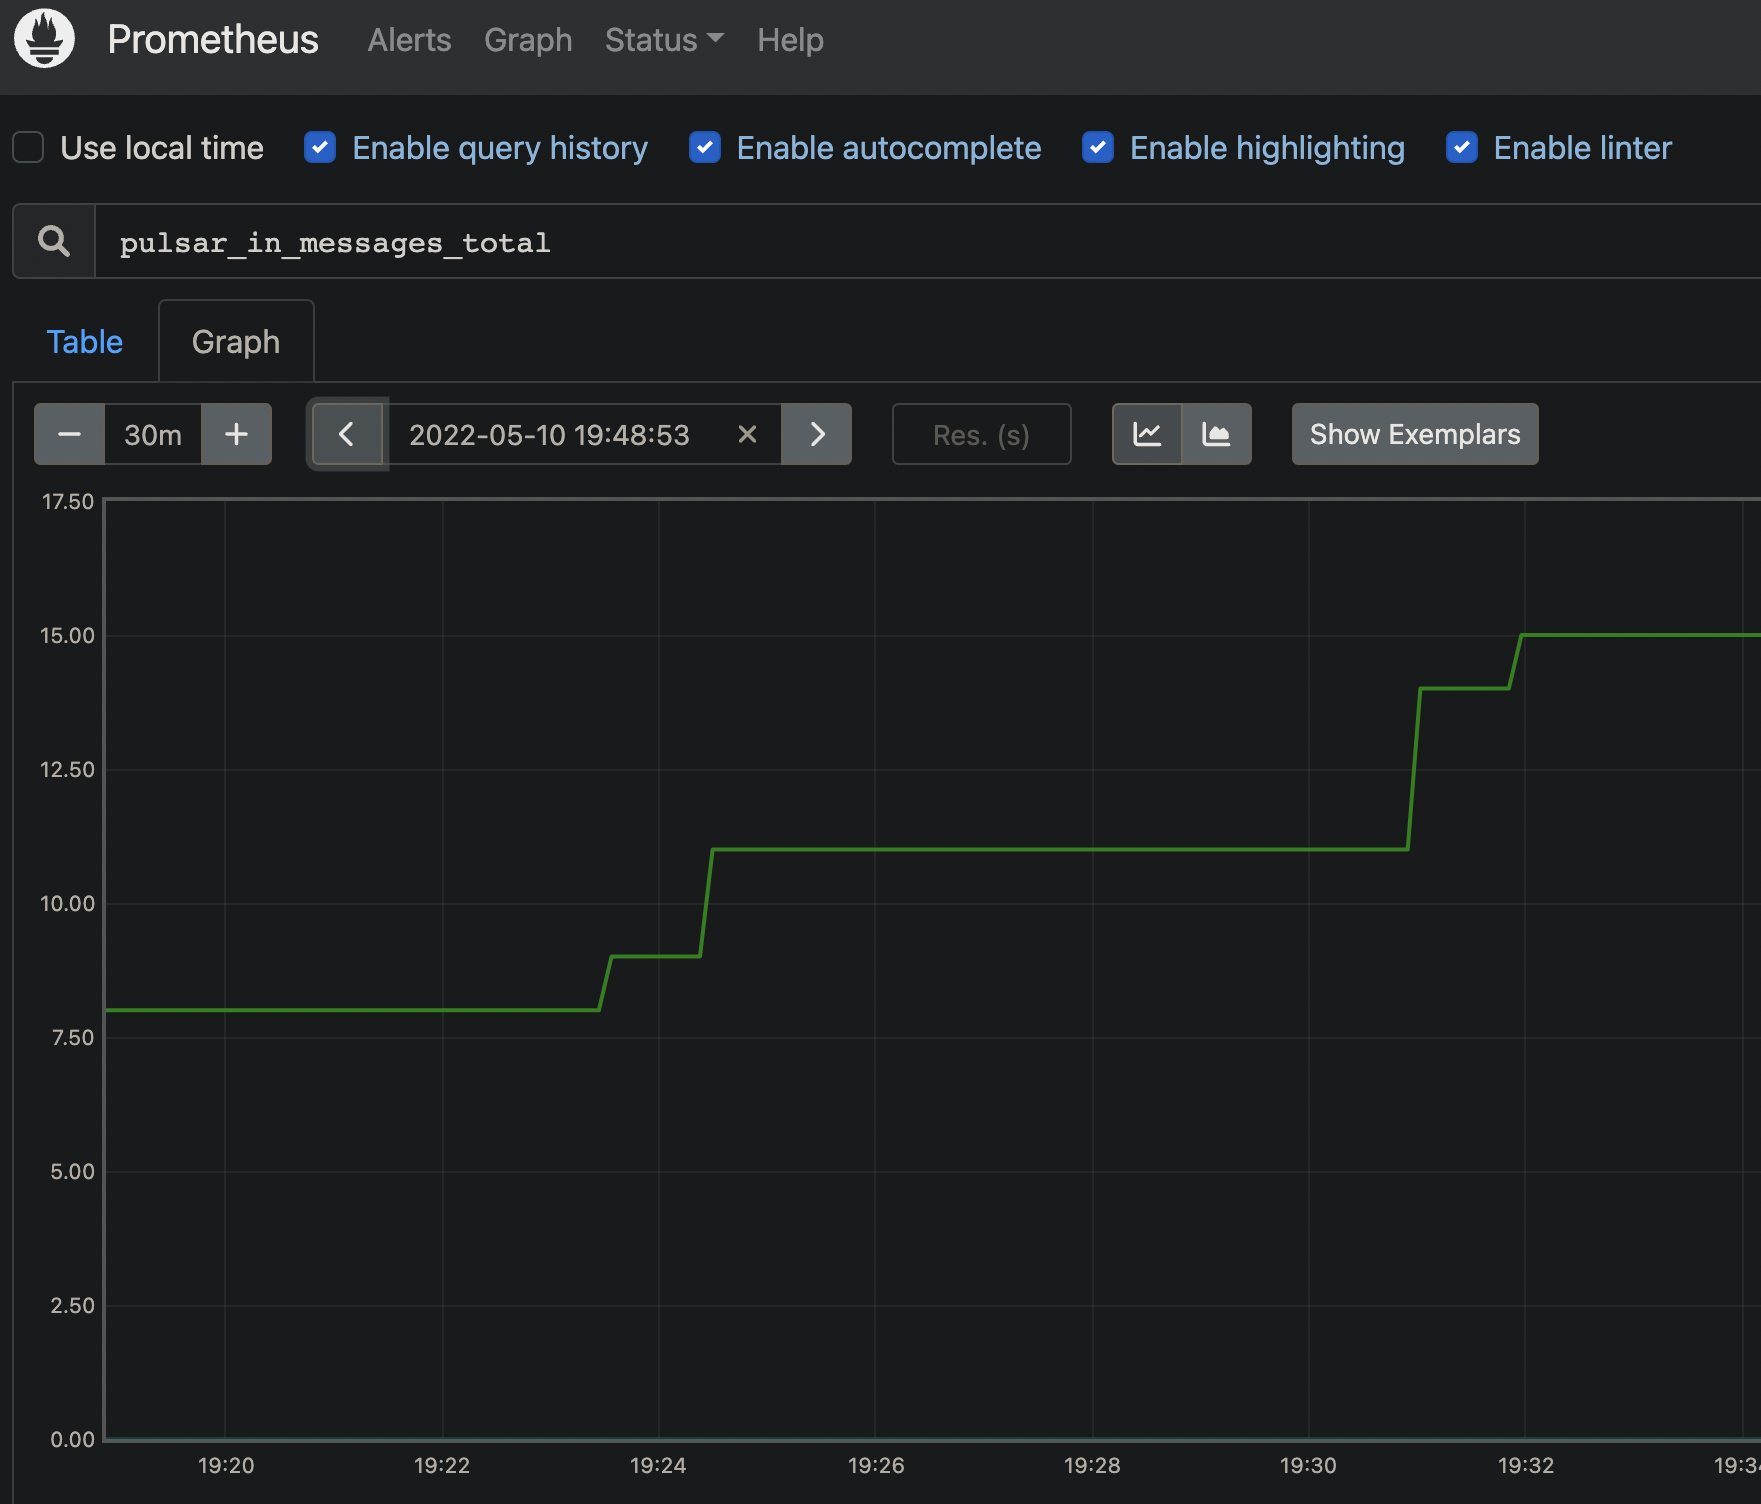
In the Expression field, enter
pulsar_in_messages_total, and then click Execute. Prometheus now shows the total incoming Apache Pulsar™ messages for your Astra Streaming cluster. -
To test the integration, produce a few messages in your tenant with the Pulsar CLI or the Astra Streaming Websocket. Make sure your Prometheus graph displays the number of incoming Pulsar messages with each 60 second scrape:
Content encoding
Astra Streaming supports content encoding with either gzip or deflate.
With your Prometheus scrape container running, you can use curl commands to decompress your Prometheus scrape data:
curl -v \
-H "Authorization: Bearer $BEARER_TOKEN" \
-H "Accept-encoding: deflate" \
https://prometheus-aws-useast1.streaming.datastax.com/pulsarmetrics/tenant-1 \
--compressedcurl -v \
-H "Authorization: Bearer $BEARER_TOKEN" \
-H "Accept-encoding: gzip" \
https://prometheus-aws-useast1.streaming.datastax.com/pulsarmetrics/tenant-1 \
| zcatDeflate or Gzip will extract your scraped metrics in a format such as the following:
# TYPE pulsar_topics_count untyped
pulsar_topics_count{app="pulsar",cluster="pulsar-aws-useast1",component="broker",controller_revision_hash="pulsar-aws-useast1-broker-7444bf6f64",instance="192.168.2.120:8080",job="broker",kubernetes_namespace="pulsar",kubernetes_pod_name="pulsar-aws-useast1-broker-1",namespace="mk-tenant/default",release="astraproduction-aws-useast1-pulsar",statefulset_kubernetes_io_pod_name="pulsar-aws-useast1-broker-1",prometheus="pulsar/astraproduction-aws-useast-prometheus",prometheus_replica="prometheus-astraproduction-aws-useast-prometheus-0"} 1 1654550685678
Metrics exposed by Astra Streaming
The following Prometheus metrics are exposed by Astra Streaming:
Cluster operational metrics are not exposed to individual cluster tenants. A tenant can only access its own metrics on the broker pod or function worker pod.
