Monitor ZDM Proxy
ZDM Proxy can gather a large number of metrics that provide you with insight into its health and operations, communication with client applications and clusters, and request handling.
This visibility is important to your migration. It builds confidence in the health of your deployment, and it helps you investigate errors or performance degradation.
DataStax strongly recommends that you use ZDM Proxy Automation to deploy the ZDM Proxy monitoring stack, or import the pre-built Grafana dashboards into your own monitoring infrastructure.
Do this after you set up ZDM Proxy Automation and deploy the ZDM Proxy instances.
Deploy the monitoring stack
ZDM Proxy Automation enables you to easily set up a self-contained monitoring stack that is preconfigured to collect metrics from your ZDM Proxy instances and display them in ready-to-use Grafana dashboards.
The monitoring stack is deployed entirely on Docker. It includes the following components, all deployed as Docker containers:
-
Prometheus node exporter, which runs on each ZDM Proxy host and makes OS- and host-level metrics available to Prometheus.
-
Prometheus server, to collect metrics from ZDM Proxy, its Golang runtime, and the Prometheus node exporter.
-
Grafana, to visualize the metrics in preconfigured dashboards.
After running the monitoring playbook, you will have a fully configured monitoring stack connected to your ZDM Proxy deployment.
Aside from preparing the infrastructure, you don’t need to install any ZDM Proxy dependencies on the monitoring host machine. The playbook automatically installs all required software packages.
-
Connect to the Ansible Control Host Docker container. You can do this from the jumphost machine by running the following command:
docker exec -it zdm-ansible-container bashResultubuntu@52772568517c:~$ -
To configure the Grafana credentials, edit the
zdm_monitoring_config.ymlfile that is located atzdm-proxy-automation/ansible/vars:-
grafana_admin_user: Leave unset or as the default valueadmin. If unset, it defaults toadmin. -
grafana_admin_password: Provide a password. Make note of this password because you need it later.
-
-
Optional: Use the
metrics_portvariable to change the metrics collection port. The default port for metrics collection is14001. -
Edit any other configuration settings as needed.
These steps assume you will deploy the monitoring stack on the jumphost machine. If you plan to deploy the monitoring stack on another machine, you must set the configuration accordingly so the playbook runs against the correct machine from the Ansible Control Host.
-
Make sure you are in the
ansibledirectory at/home/ubuntu/zdm-proxy-automation/ansible, and then run the monitoring playbook:ansible-playbook deploy_zdm_monitoring.yml -i zdm_ansible_inventory -
Wait while the playbook runs.
-
To verify that the stack is running, check the Grafana dashboard at
http://MONITORING_HOST_PUBLIC_IP:3000.If you deployed the monitoring stack on the jumphost machine, replace
MONITORING_HOST_PUBLIC_IPwith the public IP address or hostname of the jumphost.If you deployed your monitoring stack on another machine, replace
MONITORING_HOST_PUBLIC_IPwith the public IP address or hostname of that machine. -
Login with your Grafana
usernameandpassword.
Call the liveness and readiness HTTP endpoints
ZDM metrics provide /health/liveness and /health/readiness HTTP endpoints, that you can call to determine the state of the ZDM Proxy instances.
For example, after deploying the ZDM Proxy monitoring stack, you can use the liveness and readiness HTTP endpoints to confirm that your ZDM Proxy instances are running.
Liveliness endpoint
http://ZDM_PROXY_PRIVATE_IP:METRICS_PORT/health/livenessReplace the following:
-
METRICS_PORT: Themetrics_portyou set in thezdm_monitoring_config.ymlfile. The default port is 14001. -
ZDM_PROXY_PRIVATE_IP: The private IP address, hostname, or other valid identifier for the ZDM Proxy instance you want to check.
Example request with variables:
curl -G "http://{{ hostvars[inventory_hostname]['ansible_default_ipv4']['address'] }}:{{ metrics_port }}/health/liveliness"Example request with plaintext values:
curl -G "http://172.18.10.40:14001/health/liveliness"Readiness endpoint
http://ZDM_PROXY_PRIVATE_IP:METRICS_PORT/health/readinessReplace the following:
-
METRICS_PORT: Themetrics_portyou set in thezdm_monitoring_config.ymlfile. The default port is 14001. -
ZDM_PROXY_PRIVATE_IP: The private IP address, hostname, or other valid identifier for the ZDM Proxy instance you want to check.
Example request with variables:
curl -G "http://{{ hostvars[inventory_hostname]['ansible_default_ipv4']['address'] }}:{{ metrics_port }}/health/readiness"Example request with plaintext values:
curl -G "http://172.18.10.40:14001/health/readiness"Example result:
{
   "OriginStatus":{
      "Addr":"<origin_node_addr>",
      "CurrentFailureCount":0,
      "FailureCountThreshold":1,
      "Status":"UP"
   },
   "TargetStatus":{
      "Addr":"<target_node_addr>",
      "CurrentFailureCount":0,
      "FailureCountThreshold":1,
      "Status":"UP"
   },
   "Status":"UP"
}
Inspect ZDM Proxy metrics
ZDM Proxy exposes an HTTP endpoint that returns metrics in the Prometheus format.
After you deploy the monitoring stack, the ZDM Proxy Grafana dashboards automatically start displaying these metrics as they are scraped from the instances.
If you already have a Grafana deployment, then you can import the dashboards from the ZDM dashboard files in the ZDM GitHub repository.
Grafana dashboard for ZDM Proxy metrics
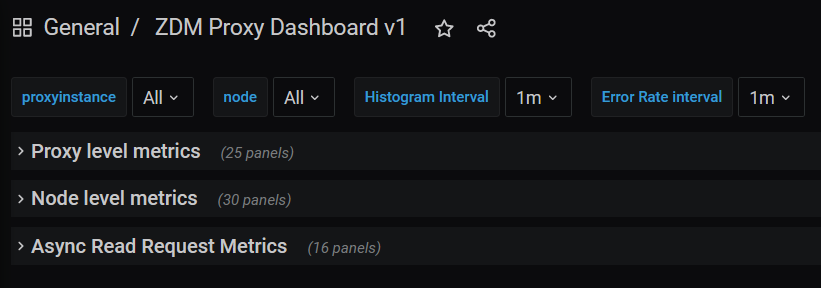
The ZDM Proxy metrics dashboard includes proxy level metrics, node level metrics, and asynchronous read requests metrics.

This dashboard can help you identify issues such as the following:
-
If the number of client connections is near 1000 per ZDM Proxy instance, be aware that ZDM Proxy will start rejecting client connections after accepting 1000 connections.
-
If Prepared Statement cache metrics are always increasing, check the entries and misses metrics.
-
If you have error metrics reporting for specific error types, evaluate these issues on a case-by-case basis.
Proxy-level metrics
-
Latency:
-
Read Latency: Total latency measured by ZDM Proxy per read request, including post-processing, such as response aggregation. This metric has two labels:
reads_originandreads_target. The label that has data depends on which cluster is receiving the reads, which is the current primary cluster. -
Write Latency: Total latency measured by ZDM Proxy per write request, including post-processing, such as response aggregation. This metric is measured as the total latency across both clusters for a single bifurcated write request.
-
-
Throughput: Follows the same structure as the latency metrics but measures Read Throughput and Write Throughput.
-
In-flight requests
-
Number of client connections
-
Prepared Statement cache:
-
Cache Misses: If a prepared statement is sent to ZDM Proxy but the statement’s
preparedIDisn’t present in the node’s cache, then ZDM Proxy sends anUNPREPAREDresponse to the client to reprepare the statement. This metric tracks the number of times this happens. -
Number of cached prepared statements
-
-
Request Failure Rates: The number of request failures per interval. You can set the interval with the Error Rate interval dashboard setting.
-
Connect Failure Rate: One
clusterlabel with two settings (originandtarget) that represent the cluster to which the connection attempt failed. -
Read Failure Rate: One
clusterlabel with two settings (originandtarget). The label that contains data depends on which cluster is currently considered the primary, the same as the latency and throughput metrics explained above. -
Write Failure Rate: One
failed_onlabel with three settings,origin,target, andboth:-
failed_on=origin: The write request failed on the origin only. -
failed_on=target: The write request failed on the target only. -
failed_on=both: The write request failed on both the origin and target clusters.
-
-
-
Request Failure Counters: Number of total request failures. Resets if the ZDM Proxy instance restarts.
-
Connect Failure Counters: Has the same labels as the connect failure rate.
-
Read Failure Counters: Has the same labels as the read failure rate.
-
Write Failure Counters: Has the same labels as the write failure rate.
-
For error metrics by error type, see the node-level error metrics.
Node-level metrics
-
Latency: Node-level latency metrics report combined read and write latency per cluster, not per request. For latency by request type, see Proxy-level metrics.
-
Origin: Latency, as measured by ZDM Proxy, up to the point that it received a response from the origin connection.
-
Target: Latency, as measured by ZDM Proxy, up to the point it received a response from the target connection.
-
-
Throughput: Same as the node-level latency metrics. Reads and writes are combined.
-
Number of connections per origin node and per target node
-
Number of Used Stream Ids: Tracks the total number of used stream IDs (request IDs) per connection type (
Origin,Target, andAsync). -
Number of errors per error type per origin node and per target node: Possible values for the
errortype label:-
error=client_timeout -
error=read_failure -
error=read_timeout -
error=write_failure -
error=write_timeout -
error=overloaded -
error=unavailable -
error=unprepared
-
Asynchronous read requests metrics
These metrics are recorded only if you enable asynchronous dual reads.
These metrics track the following information for asynchronous read requests:
-
Latency
-
Throughput
-
Number of dedicated connections per node for the cluster receiving the asynchronous read requests
-
Number of errors per node, separated by error type
Go runtime metrics dashboard
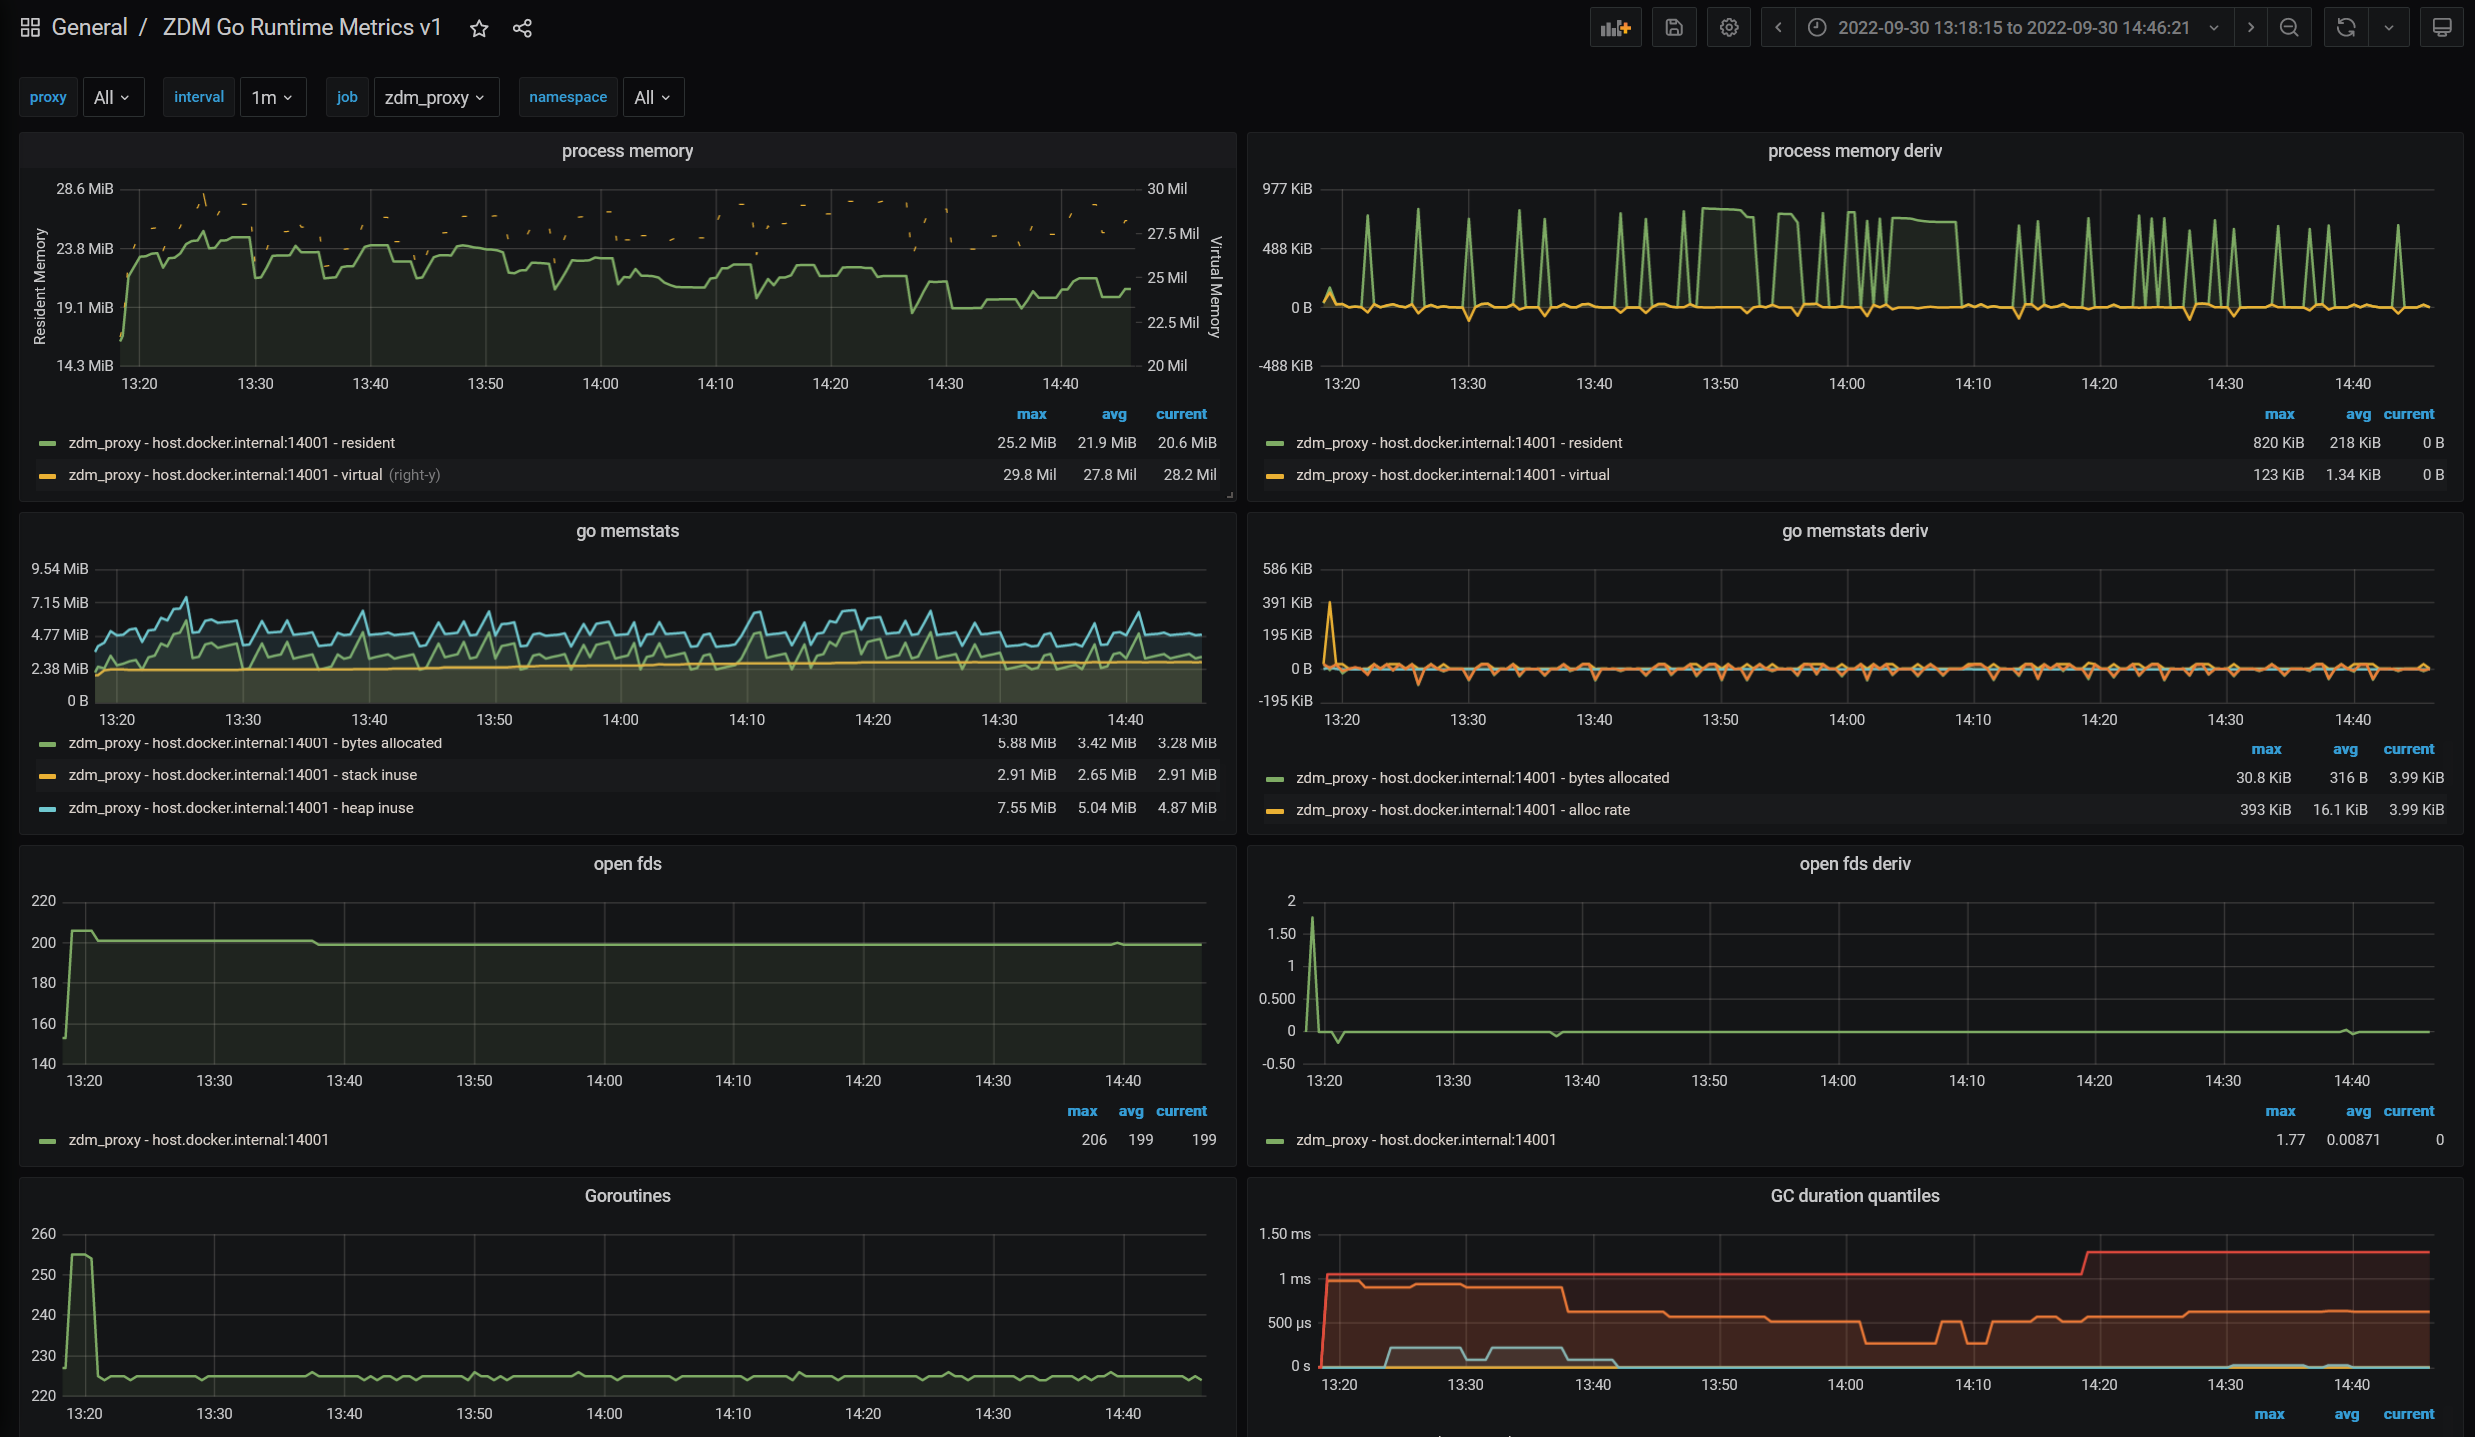
The Go runtime metrics dashboard is used less often than the ZDM Proxy metrics dashboard.
This dashboard can be helpful for troubleshooting ZDM Proxy performance issues. It provides metrics for memory usage, Garbage Collection (GC) duration, open FDs (file descriptors), and the number of goroutines.

Watch for the following problem areas on the Go runtime metrics dashboard:
-
An always increasing open fds metric; this can indicate leaked connections.
-
GC latencies that are frequently near or above hundreds of milliseconds.
-
Persistently increasing memory usage.
-
Persistently increasing number of goroutines.
System-level metrics dashboard
The ZDM monitoring stack’s system-level dashboard metrics are collected through the Prometheus Node Exporter. This dashboard contains hardware and OS-level metrics for the host on which the proxy runs. This can be useful to check the available resources and identify low-level bottlenecks or issues.
Next steps
To continue Phase 1 of the migration, connect your client applications to ZDM Proxy.
