Set up ZDM Proxy Automation with ZDM Utility
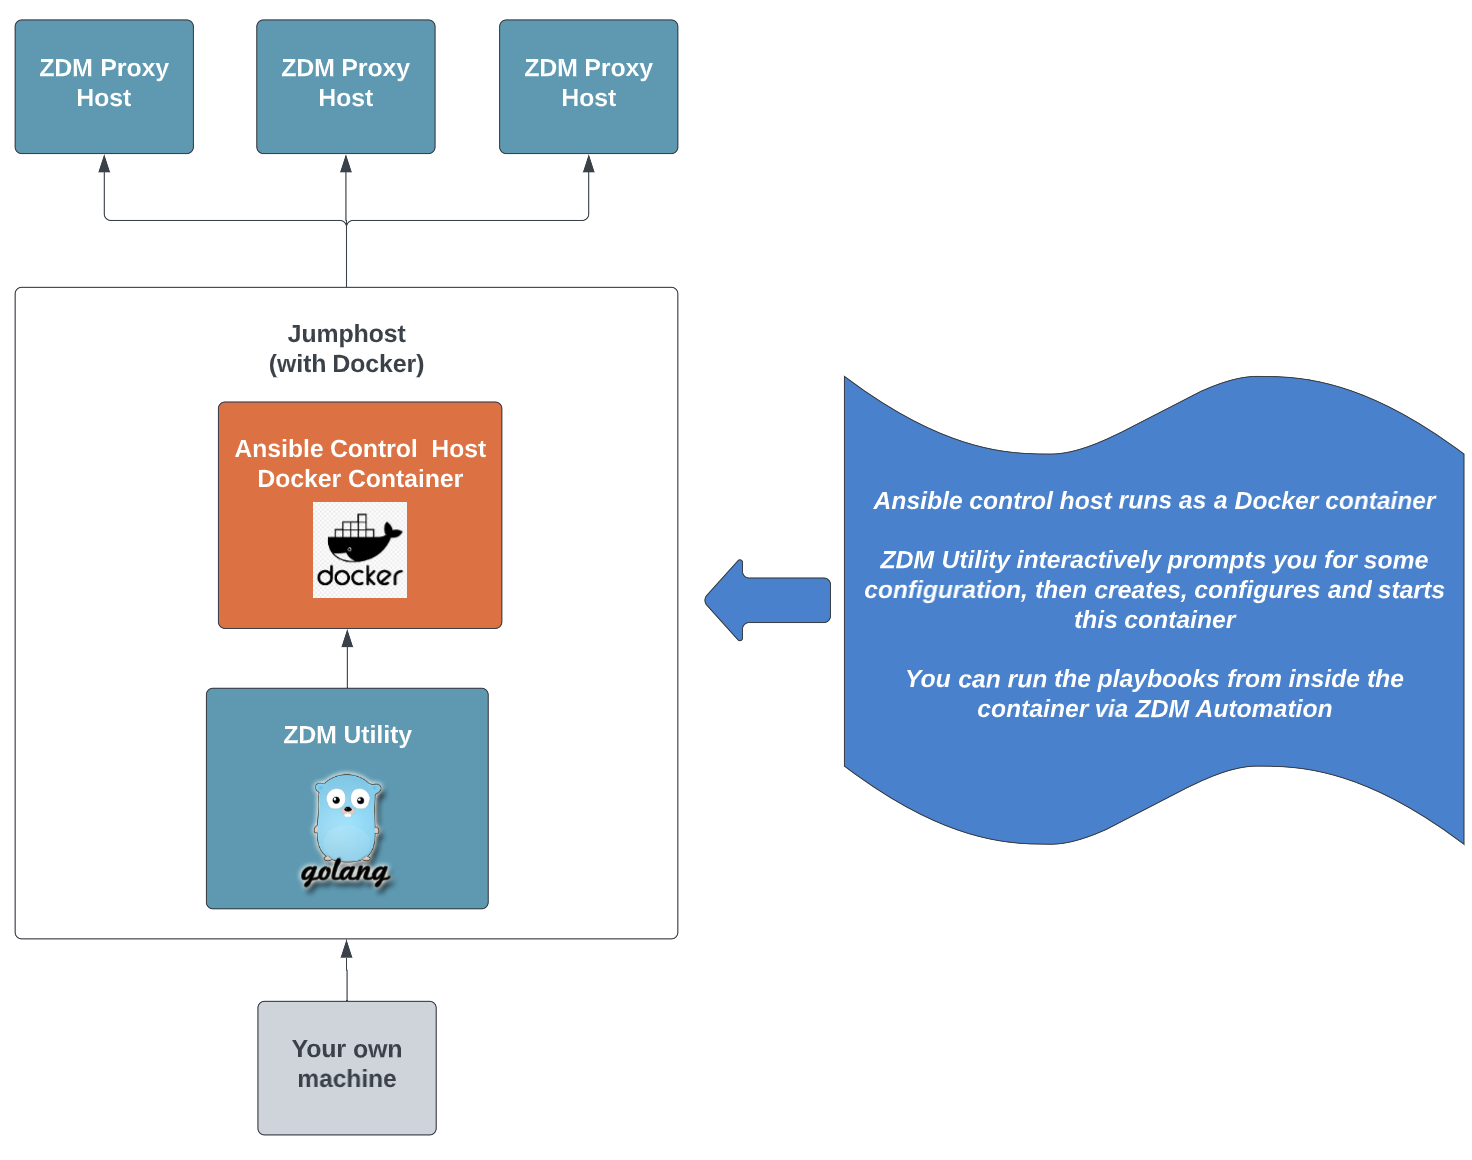
ZDM Proxy Automation uses Ansible to deploy and configure the ZDM Proxy instances and the associated monitoring stack. Specifically, these configuration processes are defined in Ansible playbooks that you execute from the Ansible Control Host container.
First, you must use ZDM Utility to set up the Ansible Control Host container, and then you can use ZDM Proxy Automation to deploy your ZDM Proxy instances and the monitoring stack. After you complete both of these procedures, you will have an active and fully monitored ZDM Proxy deployment.
ZDM Utility is a Golang (Go) executable program that runs anywhere. This utility prompts you for a few configuration values, with helpful embedded explanations and error handling, and then it creates and prepares the Ansible Control Host container automatically. From this container, you will configure and run the ZDM Proxy Automation Ansible playbooks.

For more information about ZDM Utility and ZDM Proxy Automation, see Compare DataStax migration tools.
Prerequisites
Before running ZDM Utility to create the Ansible Control Host container, you must complete the following prerequisites:
-
Provision all ZDM Proxy infrastructure: This means your server machines are ready, and you know their IP addresses.
This infrastructure can be on-premise or in any cloud provider of your choice.
If your ZDM Proxy machines use private IPs, which are recommended for production deployments, configure these before running ZDM Utility. If you enable private IPs later, you must reconfigure and redeploy your ZDM Proxy instances. This is a disruptive operation that requires a small amount of downtime because the deployment playbook decommissions and re-creates all ZDM Proxy containers simultaneously.
-
Install Docker on the machine that will run the Ansible Control Host container, and ensure that the
dockercommand doesn’t require superuser privileges.You don’t need to install Docker on any other machines. ZDM Proxy Automation will install Docker on the other ZDM Proxy machines as part of the deployment process.
Alternative Docker configurations
If you don’t want to pull images from a specific registry, or your servers don’t connect to the public internet, there are two alternative Docker configurations you can use.
- Pull from local cache
-
If your servers can connect directly to a local Docker registry, the servers can pull containers from the public internet by way of the local Docker registry. With this option, only the local Docker registry is connected to the public internet. For instructions, see the Docker documentation on configuring a pull-through cache.
- Airgapped local registry
-
Local registries that aren’t connected to the internet require administrators to manually add containers to their registry. For ZDM Utility, you need the following five containers to install and configure the jumphost, ZDM Proxy, and monitoring:
grafana/grafana:7.5.17
prom/prometheus:latest
datastax/zdm-ansible:2.x
prom/node-exporter:latest
datastax/zdm-proxy:2.x
Use a jumphost to deploy the Ansible Control Host container
This guide uses a jumphost to run the Ansible Control Host container.
A jumphost is a server on a network that is used to access and manage devices in a separate security zone, providing a controlled means of access between them. The jumphost can be, for example, a Linux server machine that is able to access the server machines that you wish to use for your ZDM Proxy deployment.
The jumphost is used to access the ZDM Proxy machines, and run the Ansible Control Host container, from which you run ZDM Proxy Automation. In this example, the jumphost also runs the ZDM Proxy monitoring stack, which uses Prometheus and Grafana to expose the metrics of all the ZDM Proxy instances to preconfigured dashboards. However, you can run the monitoring stack on a different machine.
-
Add SSH keys to the jumphost.
To run ZDM Proxy Automation, the Ansible Control Host must be able to connect to all other instances of the ZDM Proxy deployment. For this reason, it needs to have the SSH key required by those instances.
To simplify accessing the jumphost and ZDM Proxy instances from your machine, you can create a custom SSH configuration file. These steps assume that this file exists.
From your local machine, transfer (
scp) the SSH private key for the ZDM Proxy deployment to the jumphost. For example:scp -F path/to/zdm_ssh_config zdm_key_name jumphost: -
Connect to the jumphost.
ssh -F path/to/zdm_ssh_config jumphost -
From the jumphost, download the latest ZDM Utility executable from the ZDM Proxy Automation GitHub repository
.
The package filename format is
zdm-util-PLATFORM-VERSION.tgz. The following example downloads ZDM Utility version 2.3.1 for Linux amd64. To download a different package, change the version and package filename accordingly.wget https://github.com/datastax/zdm-proxy-automation/releases/download/v2.3.1/zdm-util-linux-amd64-v2.3.1.tgz -
Extract the archive:
tar -xvf zdm-util-linux-amd64-v2.3.1.tgz -
Run ZDM Utility:
./zdm-util-v2.3.1 -
Enter configuration values as you are prompted for them. ZDM Utility creates and initializes the Ansible Control Host container after it has all required configuration values.
ZDM Utility validates each value that you enter. In case of invalid values, it prompts you for the variable again and prints a message to help you fix potential problems. You have five attempts to enter valid values. If all five attempts are invalid, you must rerun ZDM Utility.
ZDM Utility stores your provided configuration values in a file named
ansible_container_init_configin the current directory. If you run the utility again, it detects this file, and then asks you if you want to use the existing configuration or discard it. If the file contains any invalid values, you are prompted for the missing or invalid parameters only.You can also pass a custom configuration file to ZDM Utility with the optional command-line parameter
-utilConfigFile. For example:./zdm-util-v2.3.1 -utilConfigFile your_config_file -
Enter the path and name of the SSH private key required to access the proxy hosts:
~/my-zdm-key -
Enter the common prefix of the private IP addresses of the proxy hosts:
172.18.* -
When prompted, provide or create an Ansible inventory file:
-
If you have an existing Ansible inventory file that is present on the jumphost, specify that file.
-
If you don’t have an Ansible inventory file, type N. ZDM Utility prompts you for the required values, and then creates a
zdm_ansible_inventoryfile in the working directory.
-
-
Indicate whether this deployment is for local testing and evaluation (such as when you’re creating a demo or experimenting with ZDM Proxy) or not. For production deployments, type N.
Depending on your environment and ZDM Utility configuration choices, your prompts might differ from the examples shown here. You might receive additional prompts that aren’t given here, or you might bypass some prompts. In any case, the utility guides you through the process with helpful hints and troubleshooting guidance. Regardless of the individual prompts, a successful outcome always results in a configured Ansible Control Host container that is ready to run ZDM Proxy Automation.
-
For production deployments, enter at least three proxy private IP addresses for the machines that will run the ZDM Proxy instances. For local testing and evaluation, only one proxy private IP address is required.
Enter each IP address on a separate line, for example:
172.18.10.137
172.18.11.88
172.18.12.191
When you are done entering IP addresses, press Return at the blank prompt.
-
Optional: When prompted, enter the private IP address of the machine where you want to deploy the ZDM Proxy monitoring stack.
You can use the jumphost or a different machine, as long as it can connect to the ZDM Proxy instances over TCP on ports 9100 (to collect host-level metrics) and the port on which ZDM Proxy exposes its own metrics, typically 14001.
You can skip this step if you haven’t decided which machine to use for monitoring, or you want to use your own monitoring stack.
DataStax strongly recommends that you configure a monitoring instance to expose ZDM Proxy metrics and preconfigured dashboards with ZDM Proxy Automation. This is the most simplified approach to ZDM Proxy montioring, and it is preferred unless you intend (or are required) to use a monitoring stack that you already have.
Metrics are essential for understanding the performance and health of your ZDM Proxy instances, especially for migrations that run over multiple days or weeks. You cannot rely solely on information in the logs. Logs report connection or protocol errors, but they don’t provide enough information about how ZDM Proxy is functioning and how each cluster is responding. In contrast, metrics provide insightful data and graphs illustrating key values and changes over time.
The following example uses the same IP address as the Ansible Control Host machine, which is the jumphost machine where ZDM Utility is running:
172.18.100.128 -
Review the configuration summary printed to the terminal by ZDM Utility. At this point, ZDM Utility has created the Ansible inventory file name
zdm_ansible_inventory(unless you provided your own custom file), and it has written the ZDM Utility configuration toansible_container_init_config.
-
Type Y to continue and trigger the following processes:
-
ZDM Utility creates and downloads the image of the Ansible Docker container.
-
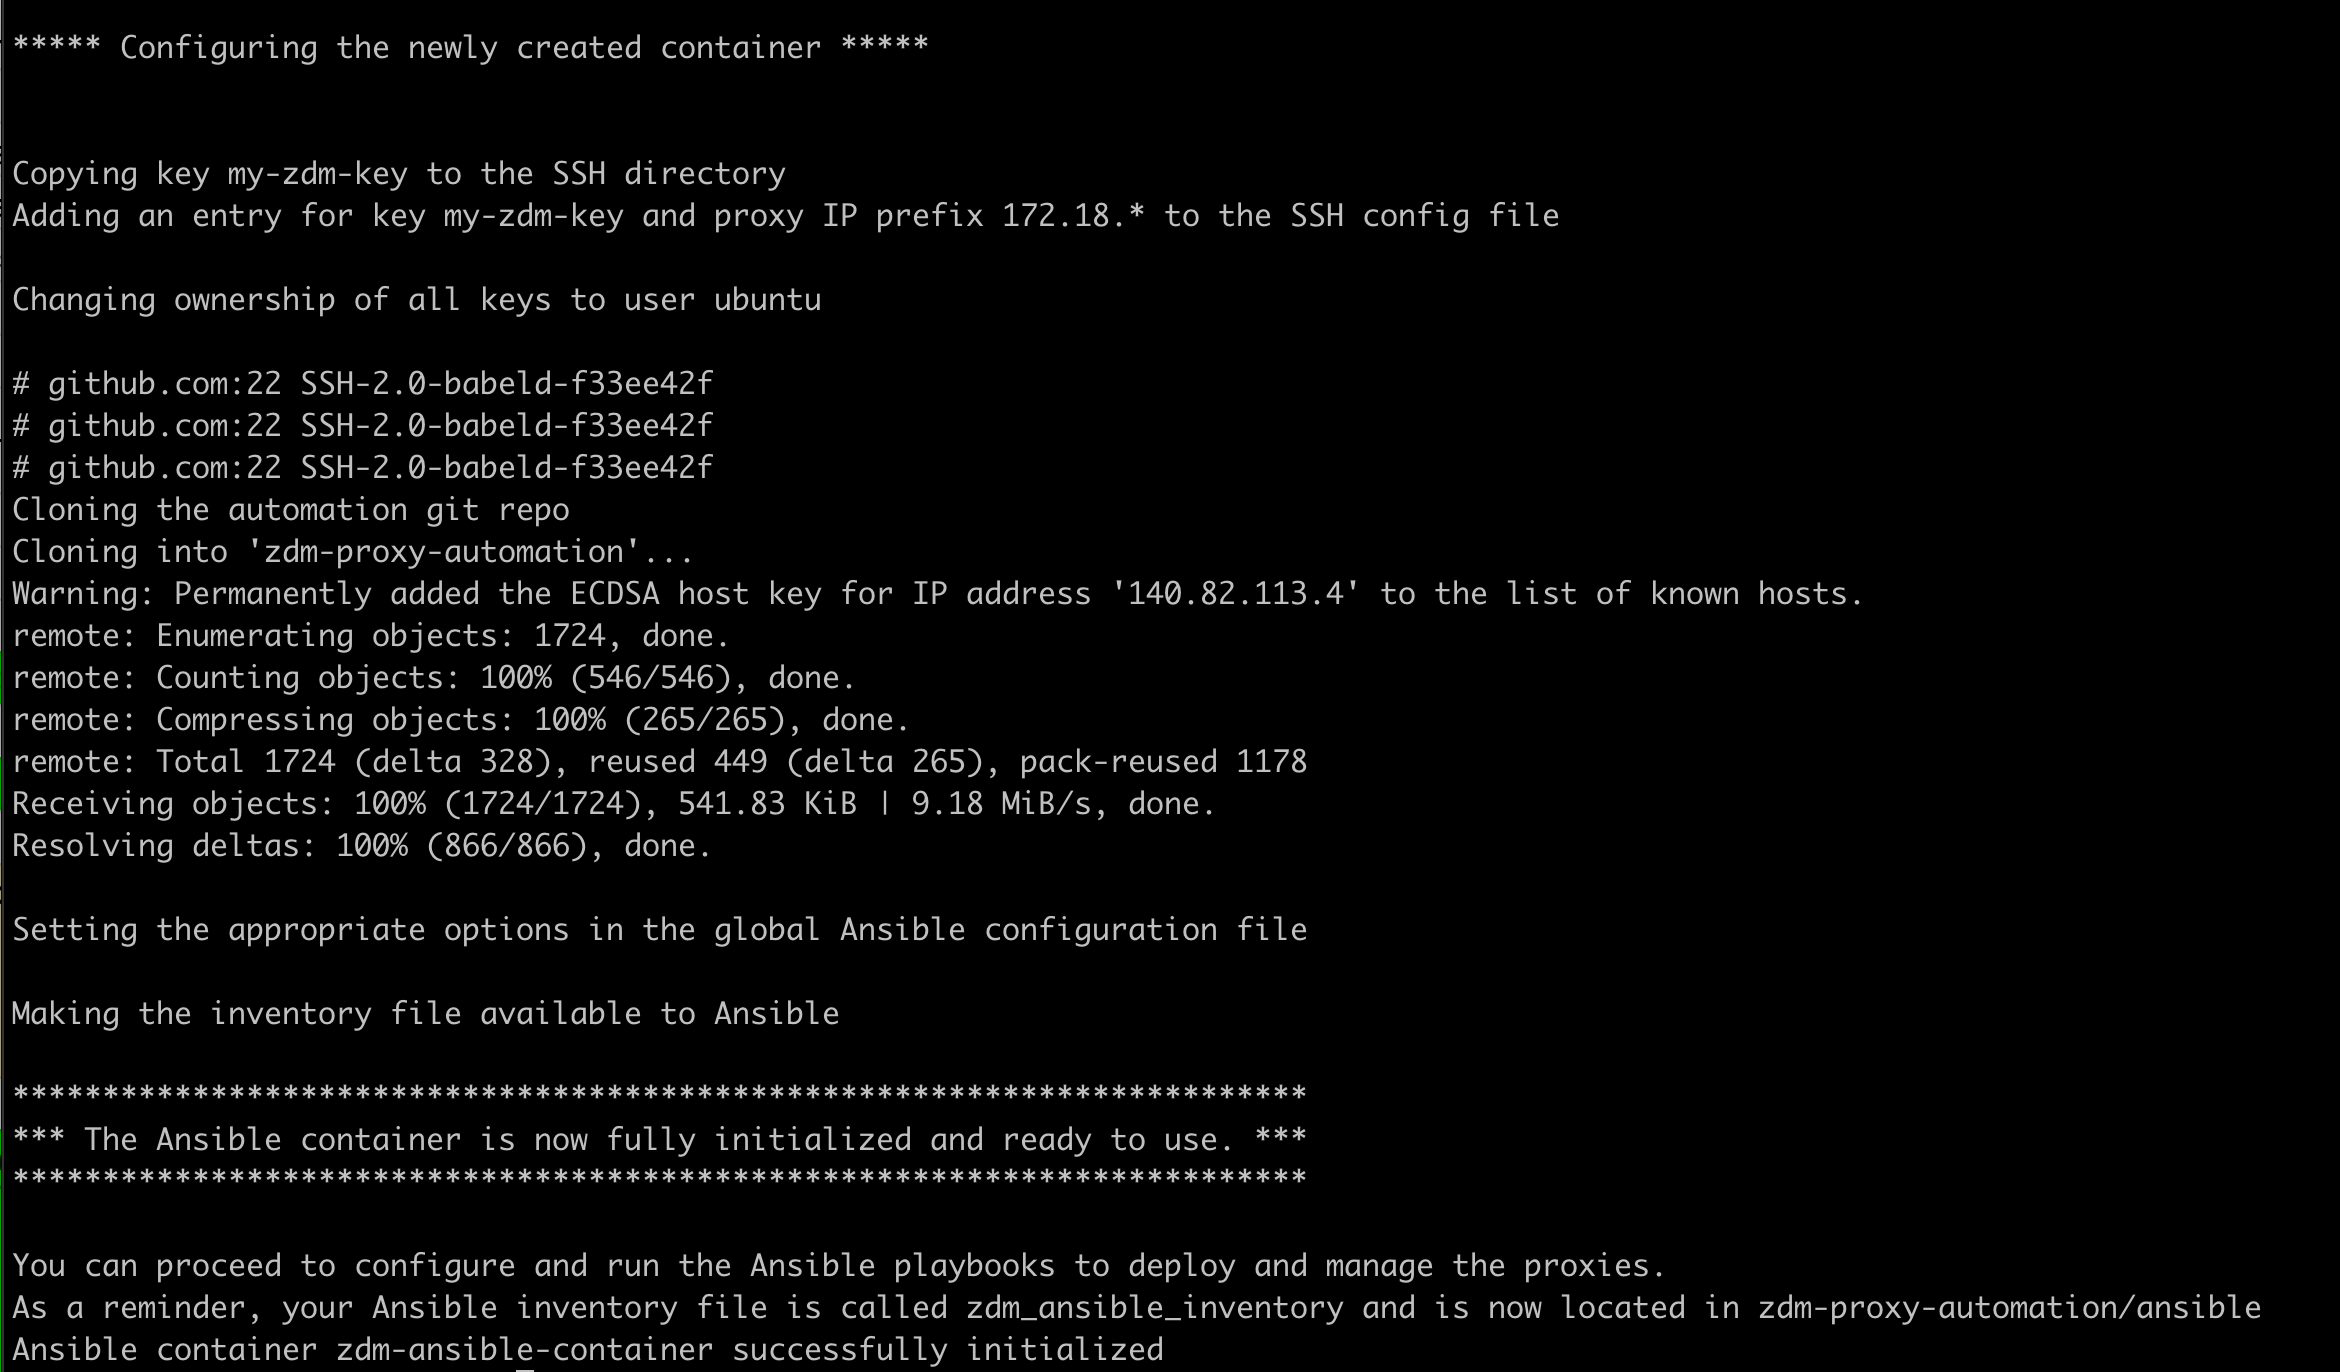
ZDM Utility creates, configures, and starts the Ansible Control Host container.
-
ZDM Utility prints a message when the Ansible container is fully initialized and ready to use.

-
Next steps
After you use ZDM Utility to set up the Ansible Control Host container, use ZDM Proxy Automation to deploy your ZDM Proxy instances.
