Exporting metrics with an existing Prometheus server
After configuring DSE Metrics Collector, you can export metrics to an existing Prometheus server. These steps use Prometheus as the monitoring solution and Grafana as the dashboard. However, other monitoring and visualization tools can be used with DSE Metrics Collector.
If you already have a Prometheus server running, this method of exporting and visualizing metrics enables use of the existing server.
-
If necessary, download and install DataStax Enterprise (DSE).
-
Download and install Prometheus, which is used as the monitoring solution, or use an existing Prometheus server.
-
Download and install Grafana, which is used as the visualization dashboard.
-
Download the prometheus.yml file from GitHub and save it in a directory on the server where Prometheus is running.
The
prometheus.ymlfile is preconfigured to scrape metrics reported by DSE Metrics Collector. Each metric uses a specific regex for the metric type.If you are already using a
prometheus.yml, integrate themetric_relabel_configs:block, which is where DSE metrics are relabelled using regular expressions in your existingprometheus.ymlfile. -
Download the
tg_dse.jsonfile and save it in the same directory as theprometheus.ymlfile.The
prometheus.ymlfile references this file to obtain the IP addresses for each cluster node. -
To use preconfigured Grafana dashboards from DataStax, download the JSON files from GitHub to your local machine. Place these files in a local directory that is accessible.
-
Configure the metrics export with Lifecycle Manager (LCM) or manually:
- With LCM
-
For clusters managed by DSE OpsCenter 6.7 and later, use LCM to export metrics collection to Prometheus.
- Without LCM
-
Create a
collectddirectory, and then configure the Prometheus server that the DSE Metrics Collector reads from:-
On the server where Prometheus is running, ensure the
prometheus.ymlandtg_dse.jsonfiles are collocated in the same directory. -
On the DSE cluster that DSE Metrics Collector reads from, create a
/collectddirectory:-
Package installations: Create the
/etc/dse/collectddirectory on all nodes in the cluster and set the required user permissions. -
Tarball installations: The
INSTALL_DIRECTORY/resources/dse/collectd/etc/collectdexists by default.
-
-
Create a
prometheus.conffile in thecollectddirectories:sudo touch prometheus.conf -
Define the Prometheus plugin:
LoadPlugin write_prometheus <Plugin write_prometheus> Port "9103" </Plugin> -
To propagate the changes, disable and then re-enable DSE Metrics Collector on any node in the cluster.
Disable DSE Metrics Collector:
dsetool insights_config --mode DISABLEDDisabling DSE Metrics Collector can take up to 30 seconds to propagate across the cluster. Wait at least 30 seconds, and then re-enable DSE Metrics Collector:
dsetool insights_config --mode ENABLED_WITH_LOCAL_STORAGE -
Ensure collectd is listening on port 9103, in addition to the typical DSE ports:
netstat -lntResultActive Internet connections (only servers) Proto Recv-Q Send-Q Local Address Foreign Address State tcp 0 0 10.100.176.166:9042 0.0.0.0:* LISTEN tcp 0 0 0.0.0.0:22 0.0.0.0:* LISTEN tcp 0 0 10.100.176.166:7000 0.0.0.0:* LISTEN tcp 0 0 127.0.0.1:7199 0.0.0.0:* LISTEN tcp 0 0 10.100.176.166:8609 0.0.0.0:* LISTEN tcp 0 0 127.0.0.1:39940 0.0.0.0:* LISTEN tcp6 0 0 :::9103 :::* LISTEN tcp6 0 0 10.100.176.166:61621 :::* LISTEN tcp6 0 0 :::22 :::* LISTENIf collectd is not listening on port 9103, ensure libaio is installed and Epoll is working. The collectd daemon will not start if Epoll is not working.
-
-
Modify the downloaded
tg_dse.jsonfile to include the IP address of each node in the cluster under"targets". The list of IP addresses is comma-delimited. Enclose each IP address in double quotation marks. -
Start Prometheus with the
--configoption to specify theprometheus.ymlfile you downloaded from the DSE Metrics Collector Dashboards repository.For example, if you saved the
prometheus.ymlfile in the/etc/dse/tmp directory, you would run the following command:./prometheus --config.file=/etc/dse/tmp/prometheus.yml -
Verify the Prometheus and Grafana targets:
-
To view the Prometheus dashboard, which displays each DSE node as a target, open a browser and navigate to
http://PROMETHEUS_SERVER_IP_ADDRESS:9090, wherePROMETHEUS_SERVER_IP_ADDRESSis the IP address where the Prometheus server is running, and 9090 is the default port where Prometheus runs. -
To view the targets that Prometheus is monitoring, open a browser and navigate to
http://PROMETHEUS_SERVER_IP_ADDRESS:9090/targets. Each of the nodes specified in thetg_dse.jsonfile displays as an endpoint, with the current status and last scrape time.
-
-
Create a Grafana dashboard to visualize metrics.
After completing the preceding configuration, you can enable the Prometheus plugin, which is included with Grafana by default, and then create a dashboard using your Prometheus data source. These steps assume an existing Prometheus server exports DSE metrics, and the you have admin privileges for your organization in Grafana:
-
Log in to your Grafana instance at
http://GRAFANA_SERVER_IP_ADDRESS:3000whereGRAFANA_SERVER_IP_ADDRESSis the IP address where your Grafana server is running. -
Open the side menu by clicking the Grafana icon in the upper left.
-
In the side menu, click Configuration, and then click Data Sources.
-
On the Configuration page, click Add data source.
-
Enter a name for your data source.
-
Select Prometheus as the data source Type.
-
Enter the URL where your Prometheus server is running.
-
Select Server or Browser, depending on where your Prometheus instance is running.
-
Click Save & Test to verify the connection to your Prometheus server.
You’ve now enabled the Prometheus plugin. Next, create a dashboard.
-
In the side menu, click Create, and then click Import.
-
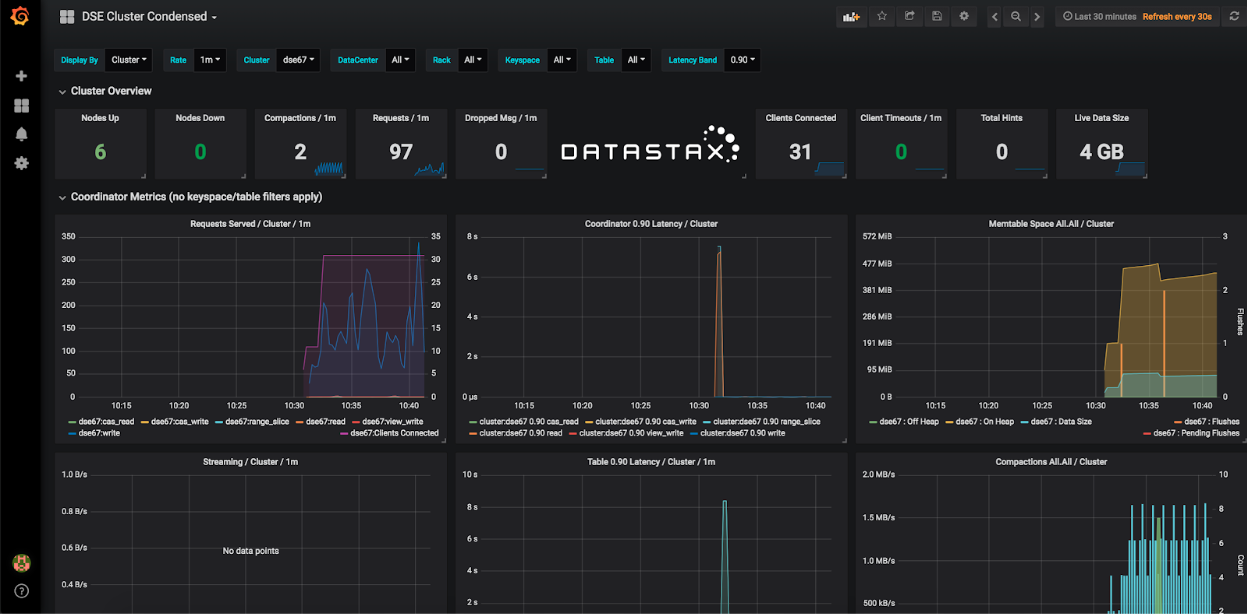
Click Upload .json file, and then select one of the preconfigured Grafana dashboard JSON files that you downloaded earlier. For example,
dse-cluster-condensed.json. -
Enter a name for the dashboard, and then click Import.
The dashboard is added to your Grafana instance.
-
